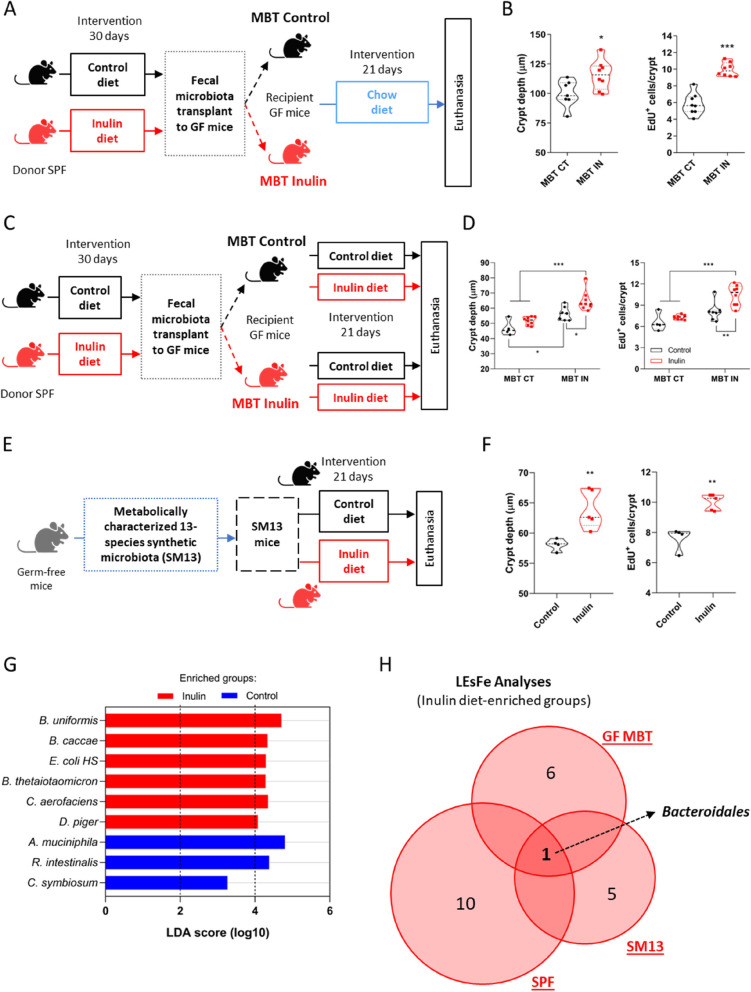
Fig. 5.
Fecal microbial transplantation recapitulates epithelial proliferation induced by the intake of inulin. A Schematic of the first fecal microbiota transplantation experiment (MBT), with SPF donors and GF recipient mice in the different diet conditions. B Quantification of colon crypt depth (left) and number of EdU-positive cells per crypt (right) (n = 7–8). C Schematic of the second fecal microbiota transplantation experiment (MBT). D Quantification of colon crypt depth (left) and number of EdU-positive cells per crypt (right) (n = 4–8). Results analyzed by two-way ANOVA. E Schematic of the gnotobiotic SM13 mice model (n = 4–5). F Quantification of colon crypt depth (left) and number of EdU-positive cells per crypt (right), the latter analyzed by Mann–Whitney test. G LEfSe analysis with LDA score of relative abundance taxa of bacteria of SM13 mice. H Venn diagrams showing the three distinct microbiota experiments and number of individual or shared bacterial groups obtained by LEfSe analysis of the inulin diet-enriched groups. SPF: specific pathogen-free mice, GF MBT: germ-free microbiota transplanted mice, SM13: gnotobiotic mice. In all graphs, each point represents an individual animal. Unless otherwise stated, results were analyzed by Student’s t-test. *p < 0.05, **p < 0.01, ***p < 0.001

