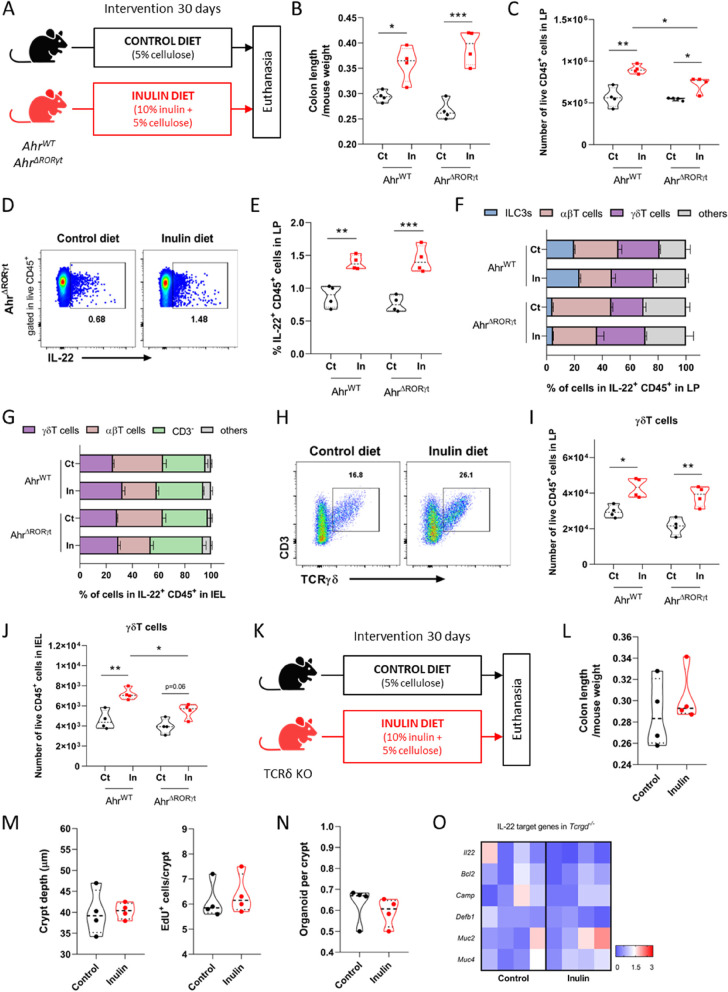
Fig. 7.
γδ T cells, but not ILC3s or αβ T cells, are pivotal for induction of colonic epithelial remodeling by inulin A Schematic of the experimental model with ILC3-deficient mice in the different diets (n = 4). B Quantification of the colon length of mice fed control (Ct) or inulin (In) diet. Results analyzed by two-way ANOVA. C-J Flow cytometry analyses of immune (CD45+) cells present in the colonic lamina propria (LP) or intraepithelial lymphocytes (IEL). C Quantification of CD45+ cells. Results analyzed by two-way ANOVA. D Gating strategy to define IL-22-positive events within the CD45+ population. E Quantification of the percentage of IL-22-positive CD45+ cells. Results analyzed by two-way ANOVA. F Percentage of IL-22 production by distinct cell types in the LP. Results analyzed by two-way ANOVA. G Percentage of IL-22 production by distinct cell types in the IEL. Results analyzed by two-way ANOVA. H Gating strategy to define the γδ T cell population. I Quantification of the γδ T cell population in the LP. Results analyzed by two-way ANOVA. J Quantification of the γδ T cell population within IEL. Results analyzed by two-way ANOVA. K Schematic of the experimental model with TCRδ KO mice in different diets (n = 4). L Quantification of colon length. M Quantification of colon crypt depth (left) and number of EdU-positive cells per crypt (right). N Quantification of clonogenicity capacity of colon crypts. Results analyzed by Mann–Whitney test. O Heatmap with relative mRNA expression of IL-22-target genes of colonic epithelial cells by RT-qPCR. In all graphs, each point represents an individual animal. Unless otherwise stated, results were analyzed by Student’s t-test. *p < 0.05, **p < 0.01, ***p < 0.001

