
Figure 4. MRX preferentially nicks DNA with a specific melting temperature profile.
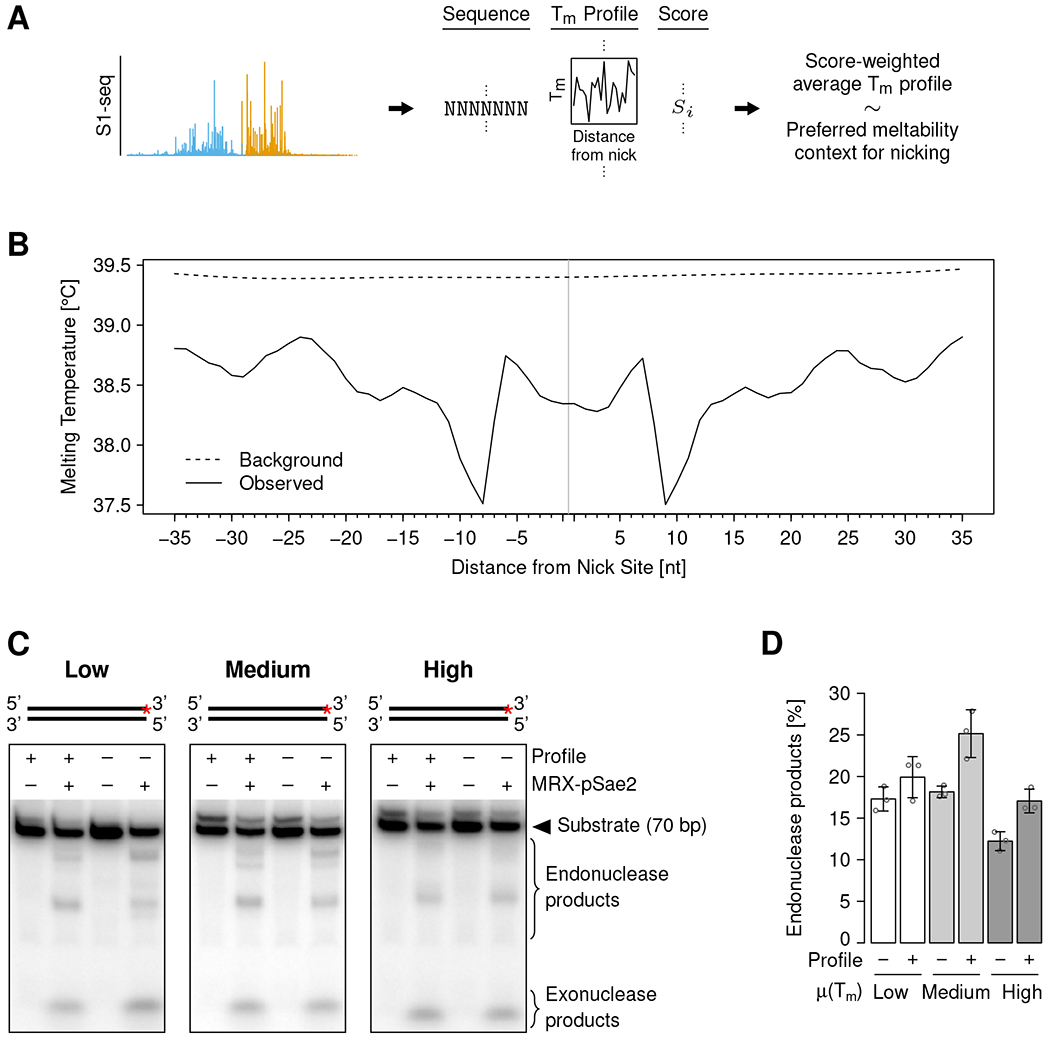
(A) Schematic of the analysis approach to identify a potential DNA melting profile preference of MRX nicking. Tm: melting temperature.
(B) Melting temperature at indicated distances from the MRX nick site (vertical gray line). Solid and dashed black lines show nicking preference (average weighted with S1-seq score) and background (unweighted average), respectively. Melting temperatures were calculated for 15-bp windows centered at the indicated distance.
(C) In vitro MRX nicking of DNA substrates containing or lacking the preferred melting temperature profile and low, medium, or high overall melting temperature, as indicated. The substrate structures are shown on top, and the red asterisks indicate the position of the radioactive label.
(D) Quantification of nicking assays such as shown in (C). Individual values (circles) and means (bar heights) ± SD (error bars) of three independent replicates are shown. μ(Tm): average melting temperature.
See also Figure S4.