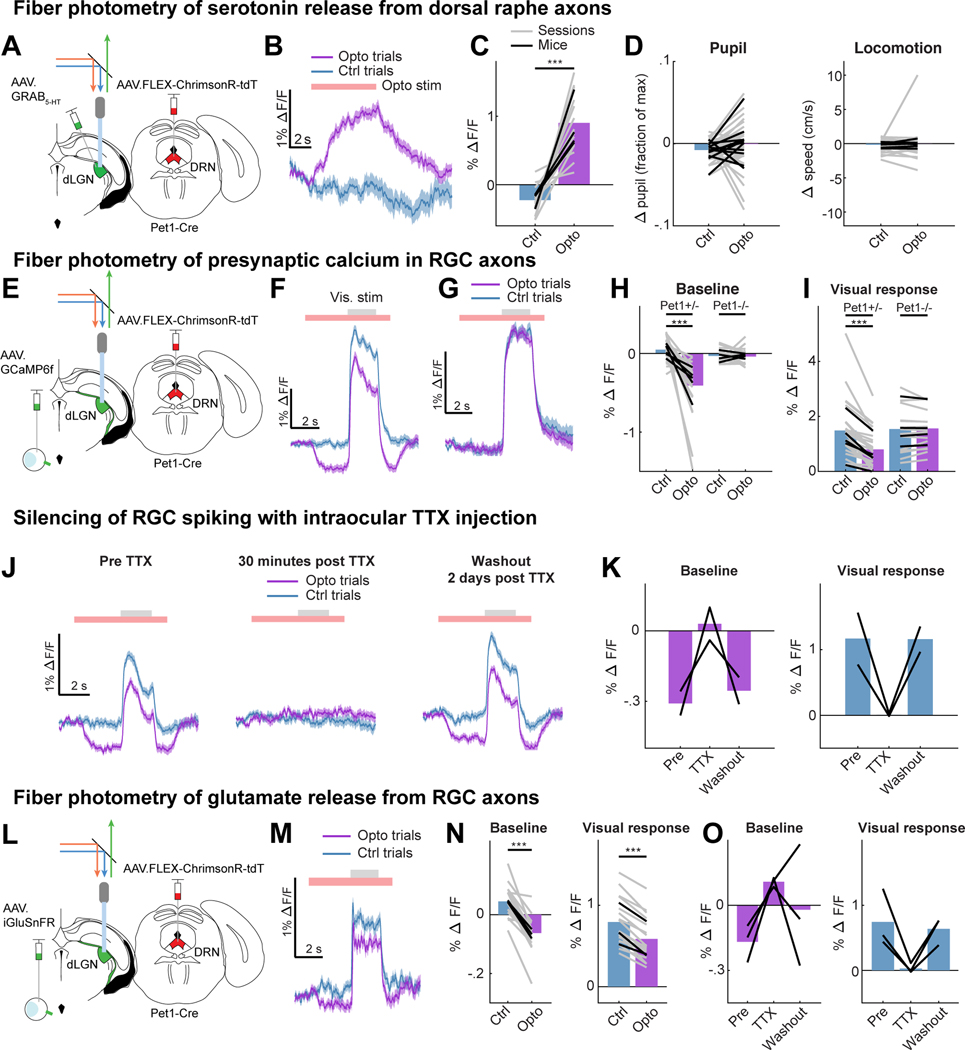
Figure 1. DRN5HT→dLGN stimulation releases serotonin and suppresses spiking-evoked calcium signals and glutamate release from RGC axons.
A. Set-up in awake head-fixed mice for fiber photometry recordings of GRAB5-HT expressed in dLGN, with optogenetic stimulation (optostim) of DRN5HT→dLGN axons (ChrimsonR-tdT injected in DRN of Pet1-Cre mice).
B. Example GRAB5-HT trace of fractional change in fluorescence (ΔF/F) on trials with (‘Opto’) and without (‘Ctrl’) optostim (red bar).
C. Mean GRAB5-HT ΔF/F on Opto and Ctrl trials (18 sessions [gray lines], 4 mice [black lines]). ***p<0.001, linear mixed effects model (LME).
D. Mean change in pupil area (left, normalized to maximum pupil size in the recording session) and running speed (right) on Opto and Ctrl trials (41 and 45 sessions, 11 and 12 mice for pupil size and running, respectively, LME: p = 0.21 for pupil, p = 0.50 for running).
E. Set-up for fiber photometry of calcium signals (GCaMP6f) from RGC axons, with optostim of DRN5HT→dLGN axons.
F. Example calcium activity trace on Ctrl and Opto trials. Gray bar: visual drifting grating.
G. Same as F but for Pet1-Cre−/− mice that lacked ChrimsonR expression.
H. Mean baseline calcium ΔF/F (mean luminance gray screen) on Opto and Ctrl trials in Pet1-Cre+/− mice (27 sessions [gray lines], 5 mice [black lines]) and Pet1-Cre−/− mice (16 sessions, 4 mice). LME: Pet1-Cre+/−, ***p<0.001; Pet1-Cre−/−, p = 0.84.
I. Same as H but for visual responses (ΔF/F0, F0 = mean of 2 s before optogenetic stimulation). LME: Pet1-Cre+/−,***p<0.001; Pet1-Cre−/−, p = 0.67.
J. Example calcium activity traces from the same mouse before, 30 minutes after and 2 days after TTX injection into the contralateral eye.
K. Mean baseline calcium ΔF/F on Opto trials (left) and visual response on Ctrl trials (right) before, 30 min after and 2 days after TTX. Black lines: mice (n = 2).
L. Set-up for fiber photometry of iGluSnFR in RGC axons with optostim of DRN5HT→dLGN axons.
M. Example trace of glutamate release on Ctrl and Opto trials (red bar). Gray bar: time of visual stimulation.
N. Mean baseline (left) and visually-evoked (right, ΔF/F0, F0 = mean of 2 s before optogenetic stimulation) glutamate release on Ctrl and Opto trials (18 sessions [gray lines], 3 mice [black lines]). LME: ***p<0.001.
O. Same as K but for iGluSnFR recordings. Black lines: mice (n = 3).
Error bars in B,F,G,J,M: mean +/− SEM across trials. See also Figure S1.

