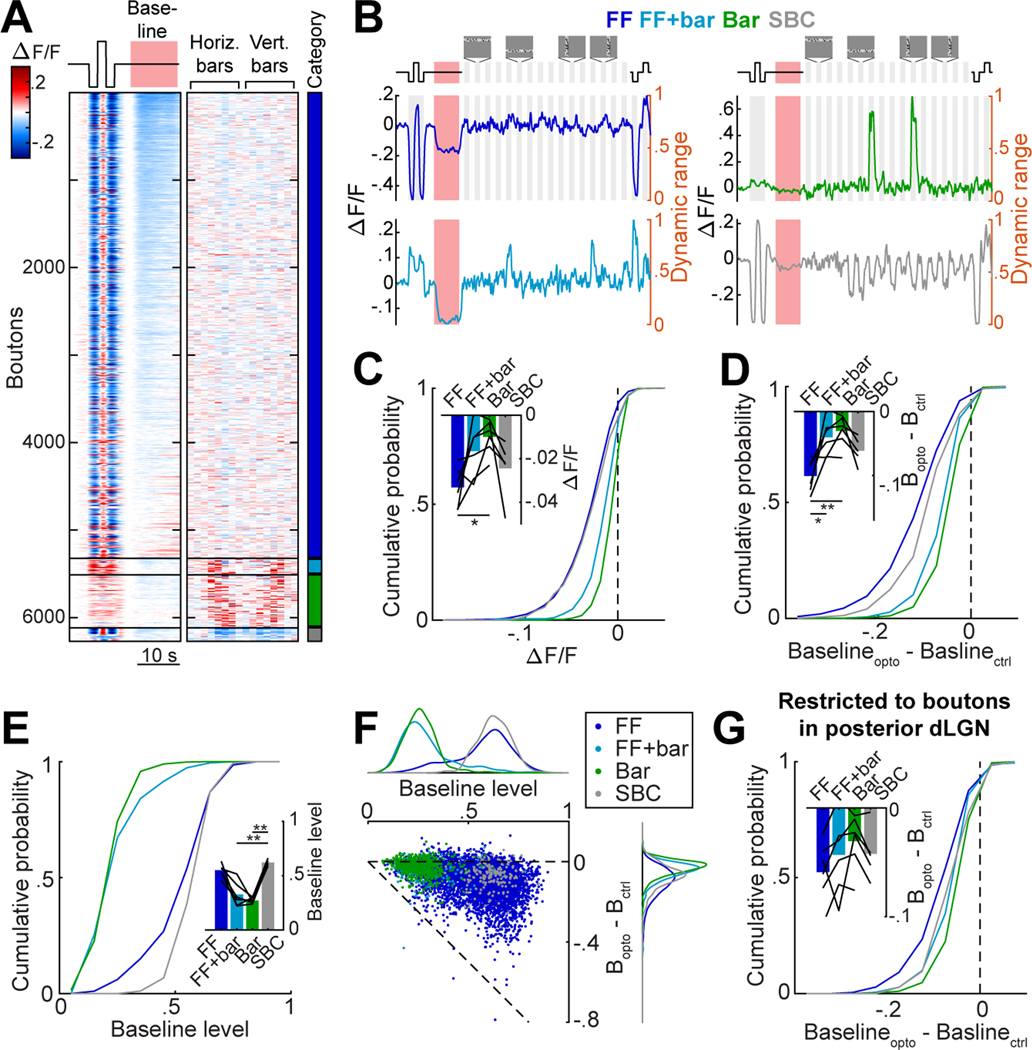
Figure 3. DRN5HT→dLGN optogenetic stimulation preferentially suppresses RGC boutons with high baseline activity and sensitivity to luminance changes.
A. Heatmap of mean concatenated responses of boutons to stepwise luminance changes, to DRN5HT→dLGN optostim at baseline (left), and to horizontal and vertical bars containing white noise (middle, see Fig. S3A, Movie S1 and Methods). Boutons are separated by category (color bar, right) and sorted by amplitude of suppression during DRN5HT→dLGN stimulation (red bar) at baseline. FF: 5,333, Bar: 599, FF+bar: 189, SBC: 178 boutons.
B. Mean concatenated responses of an example bouton from each category to stepwise luminance changes, DRN5HT→dLGN stimulation (red area), and vertical and horizontal white-noise bars. Activity levels were normalized to the bouton’s dynamic range (right y-axis): the range between the minimum and maximum activity (re-scaled to 0–1) across all stimulus types (see Methods).
C. Cumulative distributions of response to optostim at baseline for each category. LME: all distributions were significantly suppressed, p < .001; FF vs. Bar, FF vs. FF+Bar, SBC vs. FF+Bar, SBC vs. Bar p<.001, FF+Bar vs. Bar p < .01. Inset: mean per mouse (black lines, n = 6) and across mice (bars). Mouse means for FF vs. Bar: *p <.05 (Kruskal-Wallis, with post hoc Dunn’s multiple comparison).
D. Cumulative distributions of difference in baseline (normalized to dynamic range) on Opto and Ctrl trials. LME: all distributions were significantly suppressed, p < .001; FF vs. Bar, FF vs. FF+Bar, SBC vs. FF+Bar, SBC vs. Bar, FF vs. SBC: p<.001. Inset: mean per mouse (black lines, n = 6) and across mice (bars). Mouse means for FF vs. Bar: **p <.01, FF vs. FF+Bar: *p<.05 (Kruskal-Wallis with post hoc Dunn’s).
E. Cumulative distributions of mean activity during baseline (normalized to dynamic range). Inset: mean per mouse (black lines, n = 6) and across mice (bars). Mouse means for FF+bar vs. SBC, and SBC vs. Bar: **p <.01 (Kruskal-Wallis with post hoc Dunn’s).
F. Scatter plot of baseline activity vs. suppression by optostim (as in D). Dots: RGC boutons, colored by category. Top and right: distributions for each category. Pearson’s correlation across all boutons: −.379, p = 9 × 10-215.
G. Same as D, but restricted to the posterior region of dLGN containing retinotopic responses to bar stimuli. LME: all categories were significantly suppressed, p < .001; FF vs. Bar, FF vs. FF+Bar, p<.001, SBC vs. Bar, p<.01. Inset: mean per mouse (black lines, n = 6) and across mice (bars).

