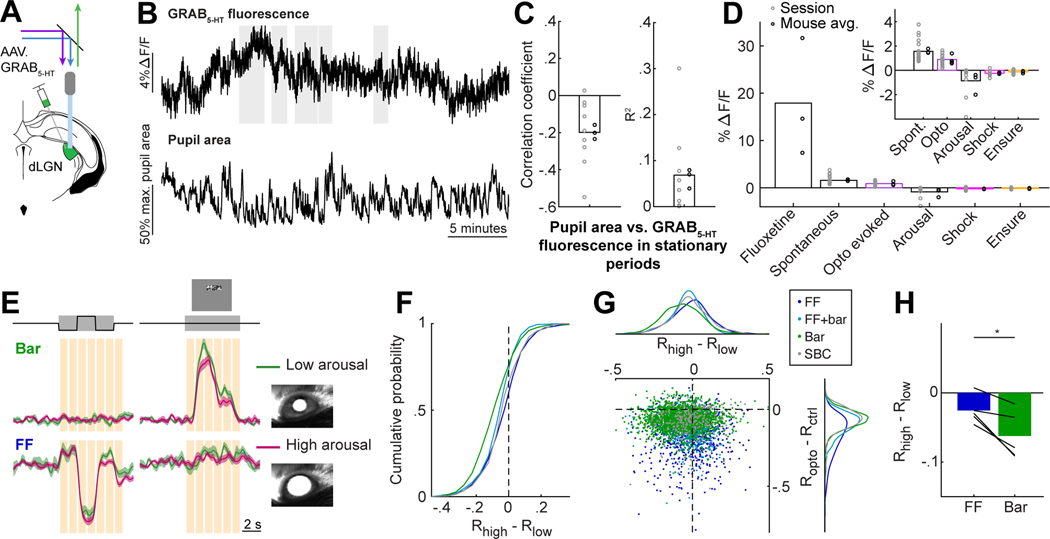
Figure 5. Different RGC boutons are suppressed by arousal and by serotonin.
A. Set-up for dual color (465 nm/405 nm) fiber photometry recordings of GRAB5-HT expressed in dLGN. Recordings at 405 nm were used to correct for motion artifact (Fig. S5A).
B. Example traces of GRAB5-HT ΔF/F and pupil area. Gray bars: stationary periods.
C. Correlation between pupil area and GRAB5-HT ΔF/F in stationary periods (Pearson’s correlation coefficient and R2 of linear regression).
D. Changes in GRAB5-HT fluorescence related to fluoxetine (Fig. S1D), optostim (Fig. 1B-C), standard deviation of spontaneous fluctuations (panel B and Fig. S1E), arousal (ΔF/Fhigh - ΔF/Flow), tail shock (Fig. S5C), and Ensure (Fig. S5B). n = 4 mice (optostim) or 3 mice (all others). Inset: expanded y axis scale.
E. Mean responses of same example boutons as in Fig. 4D, averaged separately for control trials with high arousal (magenta; pupil >50% of maximum) and low arousal (green; pupil <50% of maximum). Mean +/− SEM across trials. Orange bars: time points at which the difference between the high arousal (Rhigh) and low arousal (Rlow) trials is calculated.
F. Cumulative distributions of Rhigh - Rlow, for time points when each bouton’s activity was between .5-.7 of its dynamic range. LME: all distributions except SBC were significantly suppressed, p < .001; FF vs. Bar, FF vs. FF+Bar, SBC vs. Bar, SBC vs. FF+Bar, p<.001, SBC vs. FF p<.05. FF: 885, FF+bar: 805, Bar: 2051, SBC: 313 boutons (8 FOV, 5 mice).
G. Scatterplot of suppression by optostim vs. by arousal. Suppression by arousal and optostim showed only a weak negative correlation (r = −0.047, p < 0.001; consistent with Fig. 5C). Dots: RGC boutons, colored by category. Top and right: distributions per category.
H. Mean suppression by arousal in FF and Bar boutons (compare to Fig. 4G). Bars: means across mice; lines: means per mouse (n=5). *p<0.05, two-tailed paired t-test.
See also Figure S5.

