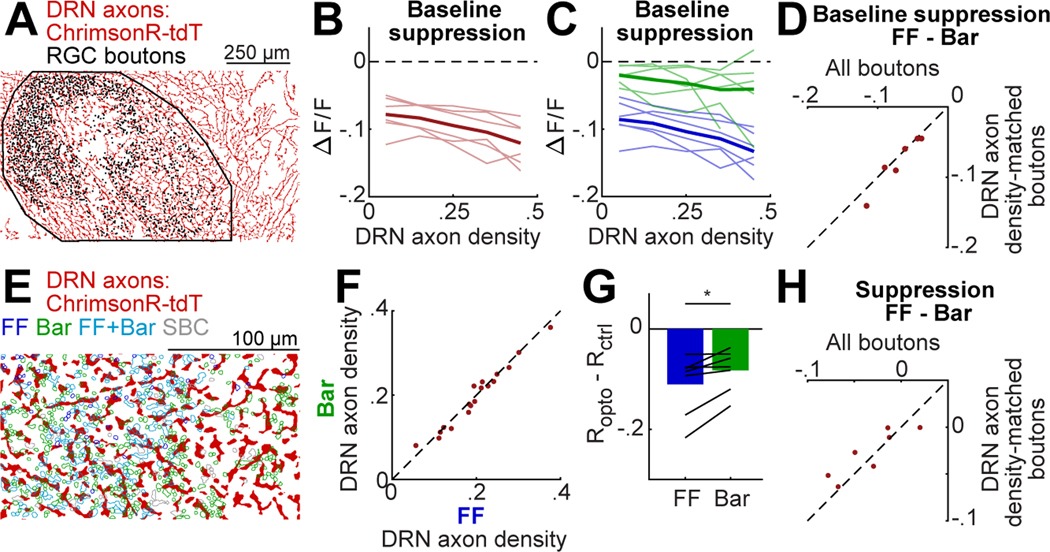
Figure 6. Local DRN axon density does not explain stronger serotonergic suppression of FF boutons.
A. Binarized image of DRN axons in dLGN (see Fig. 2C). Dots: bouton locations. Black line: dLGN outline.
B. Mean suppression by DRN5HT→dLGN optostim at baseline as a function of nearby DRN axon density (fraction of pixels with a DRN axon in a 10 μm radius of a bouton’s center of mass, see Methods). Thin lines: mean per mouse (n = 6), thick line: mean across mice.
C. Same as B, but plotted separately for FF and Bar boutons.
D. Mean difference in optostim-evoked suppression between FF and Bar boutons, calculated using all boutons or using only boutons with nearby DRN axon density between .25-.4 (i.e. ‘axon density-matched boutons’).
E. Binarized image of DRN axons (red) in a high-magnification FOV (Fig. 4). RGC bouton ROIs are colored by category.
F. Mean DRN axon density around FF vs. Bar boutons for each FOV.
G. Mean optostim-evoked suppression (see Fig. 4G) for FF and Bar boutons at .5-.7 of their dynamic range, restricted to boutons with DRN axon density between .15 and .3. Bars: mean across mice; black lines: means per mouse (n=8). *p<0.05, two-tailed paired t-test.
H. Mean difference per mouse in optostim-evoked suppression between FF and Bar boutons using all boutons (as in Figure 4G) or subsets of boutons with nearby DRN axon density between .15 and .3.
See also Figure S6.

