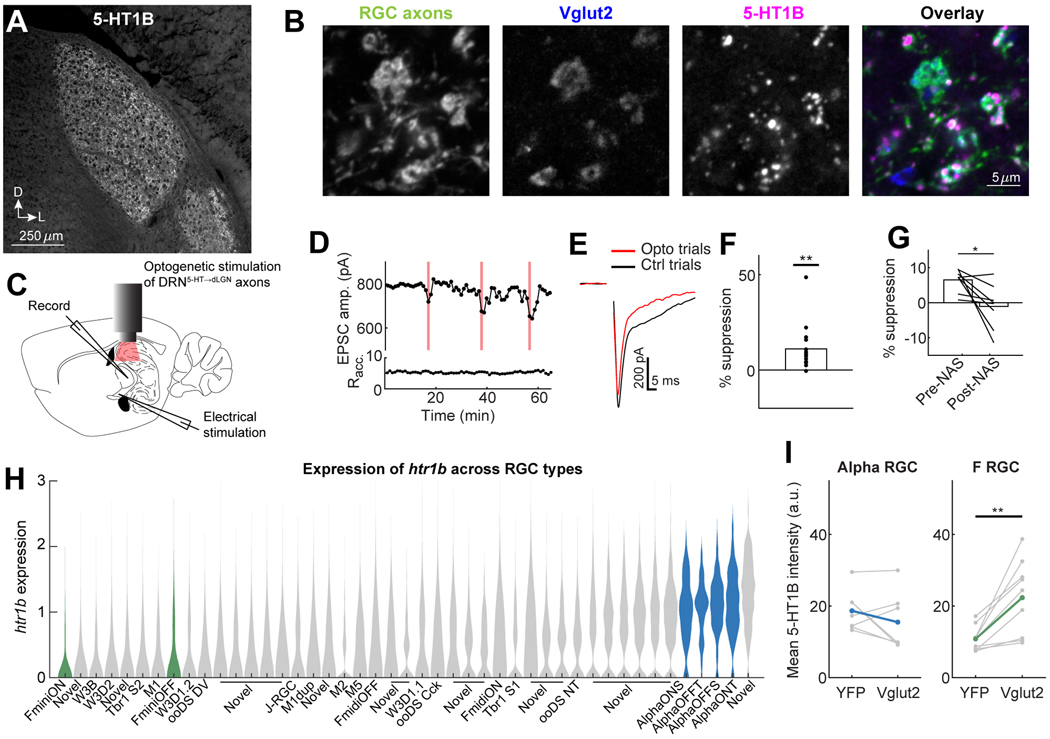
Figure 7. 5-HT1B is localized to RGC boutons and mediates DRN5HT→dLGN -evoked suppression.
A. Coronal slice of dLGN immunostained for 5-HT1B.
B. Example colocalization of 5-HT1B puncta (magenta) with Vglut2 (blue, RGC axon terminals) and RGC axons (green, Chx10-Cre; FLEX-ChR2-YFP).
C. Set-up of whole-cell recording of thalamocortical cells in a dLGN slice from Pet1-Cre mice. EPSCs are evoked by optic tract electrical stimulation with and without optostim of ChrimsonR-expressing DRN axons.
D. Plot of the peak EPSC amplitude (holding potential: −70 mV) and access resistance (Racc.) over consecutive trials of optic tract stimulation. Red bars: optostim trials.
E. Example EPSC from the recording in D on Opto and Ctrl trials (Ctrl, mean of five preceding trials). Stimulus artifacts are blanked for clarity.
F. Mean percent suppression across all 16 recorded cells (dots) from 14 mice. **p<0.01, two-tailed t-test.
G. Mean percent suppression before and after bath application of NAS-181. DRN5HT→dLGN-evoked suppression was reduced by NAS-181 in 7/8 cells (black lines). *p<0.05, two-tailed paired t-test.
H. Violin plot of htr1b expression (in log Transcripts Per Million [TPM]) in all molecularly-defined RGC types (publicly available scSeq dataset of adult RGCs). Green: F-mini RGCs, blue: alpha RGCs.
I. Mean intensity of 5-HT1B staining within all Vglut2+ regions of interest (ROIs) in a slice, compared with ROIs that overlapped with specific RGC axons (labeled with YFP using Kcng4-Cre mice [alpha RGCs] or Foxp2-Cre mice [F-mini RGCs], see Methods). Kcng4-Cre: 7 slices [gray lines], 3 mice, Foxp2-Cre: 9 slices, 4 mice; colored lines: mean across slices. **p<0.01, two-tailed paired t-test (F-mini RGC: p = 0.0042; alpha RGC: p = 0.253).
See also Figure S7.

