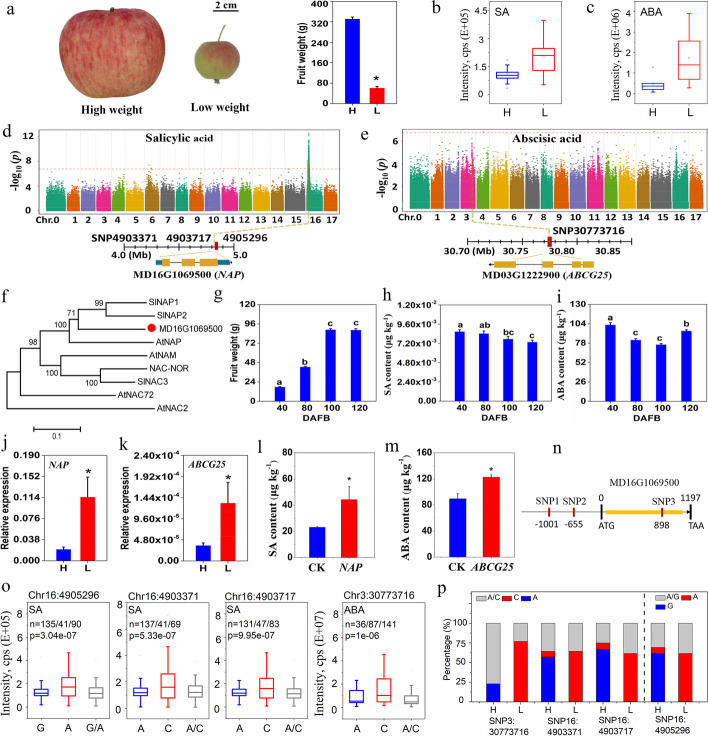
Fig. 6.
Functional analysis of GWAS for SA and ABA content related to apple fruit weight. Fruit weight (a), SA (b), and ABA (c) contents in high- (H) and low- (L) weight domesticated fruits. d,e Manhattan plots of SA and ABA contents by GWAS. f An unrooted phylogenetic tree was constructed for MD15G1051400 and other NAC members. Fruit weight (g), SA (h), and ABA (i) contents during fruit development. j,k qRT-PCR analysis of NAP (MD16G1069500) and ABCG25 (MD03G1222900) in H and L apple groups. l,m Results of transient overexpression of NAP and ABCG25 in apple fruits. n Nucleotide polymorphisms identified in the promoter and coding sequence of NAP. o Box plot of SA and ABA correlated with identified nucleotide polymorphism. p Nucleotide polymorphisms in H and L apple groups. DAFB, days after full bloom. Data are expressed as mean ± sd. “*” indicate p ≤ 0.05 by t-test

