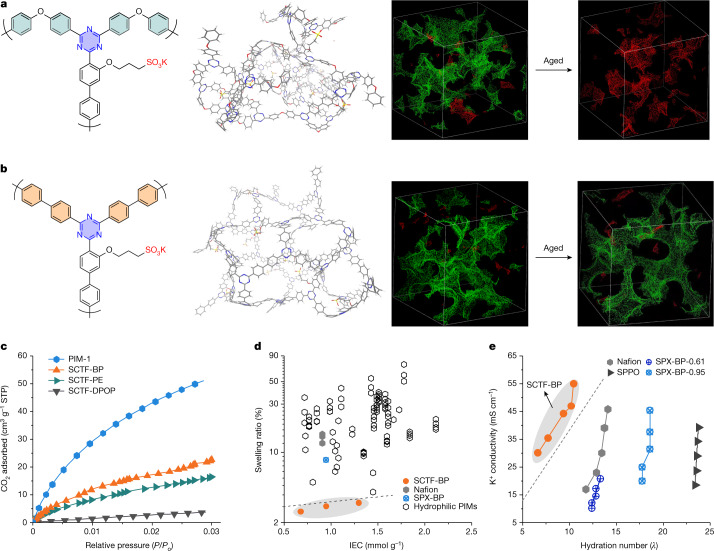
Fig. 2. Characterization of negatively charged CTF membranes (SCTF).
a,b, Schematic representation of the chain structure of SCTF-PE (a) and SCTF-BP (b), with a flexible and a very rigid chain, respectively (left). 3D view of the amorphous cells of SCTF-PE and SCTF-BP membranes (middle). Images of aged cells shown on the right. Red shading represents isolated free-volume elements and green shading represents interconnected micropores. c, CO2 uptake (at 273 K) of SCTF samples compared with that of PIM-1. d, Swelling ratio plotted as a function of IEC (the content of charged functional groups, in mmol g−1) for SCTF-BP, Nafion, SPX-BP and hydrophilic PIM membranes. e, K+ conductivity plotted as a function of hydration number for SCTF-BP, Nafion, SPX-BP and SPPO membranes. Each dot represents measurement at a separate temperature: from left to right, 30–70 °C. Dashed lines and shading are a visual guide only. d,e, The values shown can be found in Supplementary Tables 1 and 3. STP, standard temperature and pressure.

