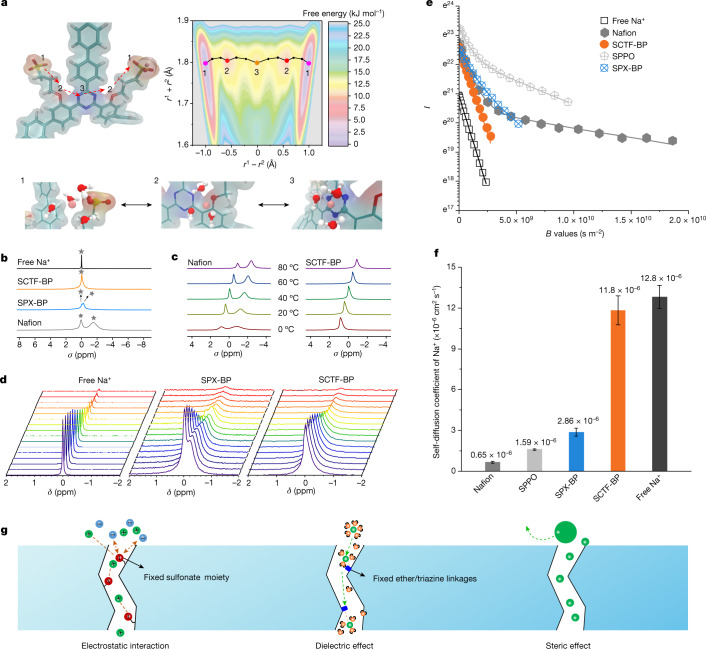
Fig. 3. Ion transport across the SCTF-BP membrane.
a, Modelling and calculation of free energy for the transport of K+ across the SCTF-BP membrane matrix; the path 1-2-3-2-1 has the lowest free energy for K+ transport. Insets demonstrate the specific interaction between K+ and SCTF-BP chains in positions 1, 2 and 3. b, ssNMR measured for membrane samples of SCTF-BP, SPX-BP and Nafion. 100 mM NaCl in water was used as control, with membrane samples immersed in 0.1 M NaCl solution (Na+ rather than K+ because of improved NMR sensitivity). c, 23Na ssNMR for Nafion and SCTF-BP membranes in 0.1 M NaCl solution at varying temperature. d, PFG–NMR spectra collected for 0.1 M NaCl solution and membrane samples of SPX-BP and SCTF-BP. Spectra for Nafion and SPPO are given in Supplementary Fig. 20. e,f, Plot of PFG–NMR signal intensity versus magnetic gradient strength (e, B values) and diffusion coefficients derived from PFG–NMR for Na+ in water, SCTF-BP, SPX-BP, Nafion and SPPO membrane samples (f). Echo profiles are fitted to the Stejskal–Tanner equation. I denotes the echo height at a given gradient strength; B denotes the product of all parameters before the diffusion coefficient (D) of the Stejskal–Tanner equation (that is, equation 9 in Supplementary Information); r1 and r2 denote the distance between the potassium ion and the geometric centre of two adjacent sulfonate groups. Error bars (s.d.) are derived from three measurements based on three individual membrane samples. g, Schematic showing electrostatic interaction and dielectric and steric effects during ion transport enabled by the negatively charged CTF membrane.

