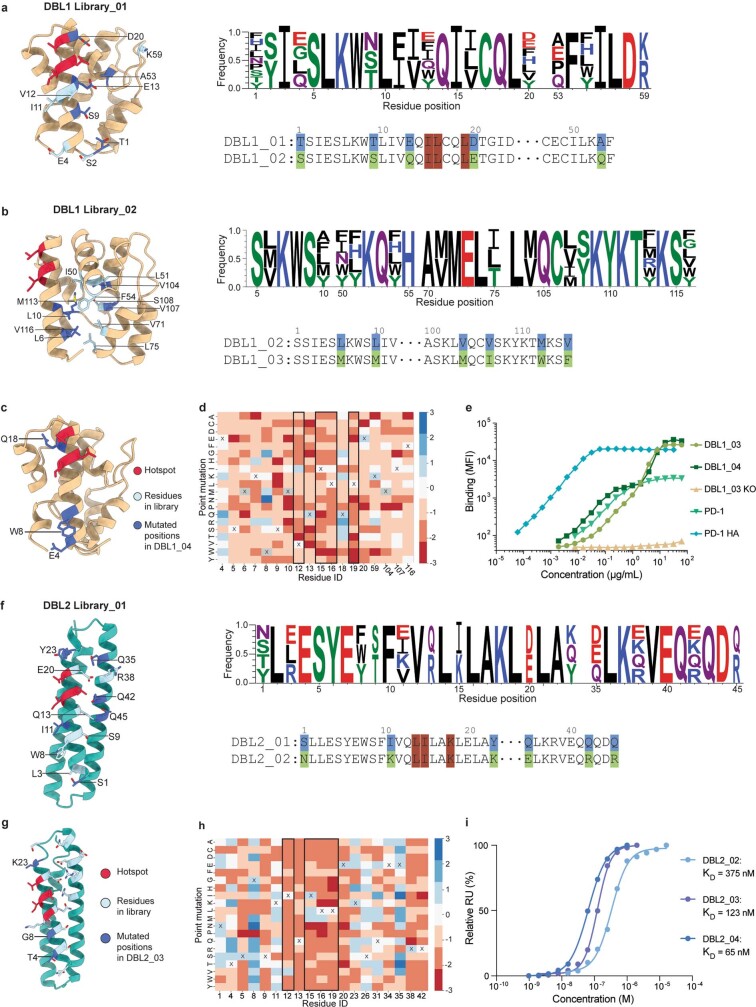
Extended Data Fig. 5. Yeast libraries, SSM and binding data of DBL1/DBL2_02.
a, Position of targeted residues in the structure of DBL1_01 to improve binding affinity. Logo plot of the allowed mutations in the library and alignment of initial design with library enriched design. b, Position of targeted residues in the structure of DBL1_02 to improve core packing. Logo plot of the allowed mutations in the library and alignment of DBL1_02 with library enriched design. c, Structural representation of all positions sampled in the SSM library (light blue). The four hotspot residues (red) were also sampled. Three positions were mutated in DBL1_04 (dark blue). d, Outcome of the entire SSM library of DBL1_03. Blue indicates enrichment in the binding population, while red shows enrichment in the non-binding population. e, Binding of DBL1_03 and DBL1_04 to KARPAS299 cells expressing PD-L1 compared to binding of WT PD-1, a high affinity version of PD-1 (PD-1_HA)35 and a V12R mutation of DBL1_03 (KO). All proteins contained a Fc domain. f, Position of targeted residues in the structure of DBL2_01 to improve binding affinity and solubility. Logo plot of the allowed mutations in the library and alignment of initial design with library enriched design. Hotspot residues red, targeted residues light blue, mutated residues dark blue. g, Structural representation of all positions sampled in the SSM library (light blue). The four hotspot residues (red) were also sampled. Three positions were mutated in DBL2_04 (dark blue). Position 35 was not mutated in DBL_04, because all mutations in this position led to the inability of the soluble expression of the protein. h, Outcome of the entire SSM library of DBL2_03. Blue indicates enrichment in the binding population, while red shows enrichment in the non-binding population. i, Binding affinities measured by SPR for the different versions of DBL2.

