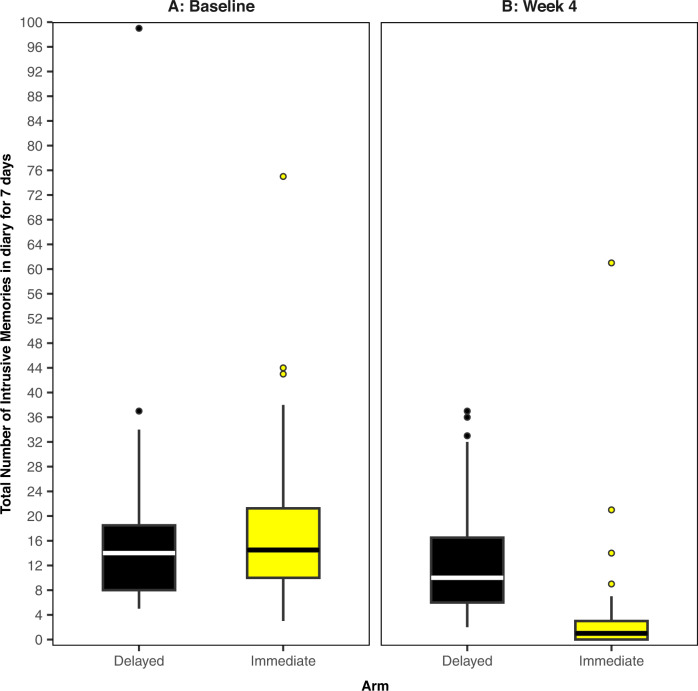
Fig. 2. Boxplots for intrusive memory (IM) measures.
The midline of the boxplot is the median value, with the upper and lower limits of the box being the third and first quartile (75th and 25th percentile), and the whiskers covering 1.5 times the IQR. The dots depict outliers (each dot represents one participant that departed more than 1.5 times the IQR above the third quartile and below the first quartile). All outliers are included in this figure. A Baseline measure for each arm. Total number of IMs of traumatic events recorded by participants in a brief daily online intrusive memory diary for 7 days during the baseline week (i.e. run-in week) for both arms (black = delayed arm (control); n = 39: usual care for 4 weeks; yellow = immediate arm; n = 36: immediate access to the intervention following the baseline week: the intervention consisted of a cognitive task involving a trauma reminder-cue plus Tetris® computer gameplay using mental rotation plus symptom monitoring), showing that the two arms did not differ at baseline (i.e., before the intervention was provided to the immediate arm). B The primary outcome measure for each arm. Total number of IMs of traumatic events recorded by participants in a brief daily online intrusive memory diary for 7 days during week 4 for each arm (black = delayed arm (control); n = 39: usual care for 4 weeks; yellow = immediate arm; n = 36: immediate access to the intervention following the baseline week: the intervention consisted of a cognitive task involving a trauma reminder-cue plus Tetris® computer gameplay using mental rotation plus symptom monitoring), showing that the immediate arm had fewer IMs at week 4 compared to the delayed arm, and that the number of IMs for the immediate arm decreased between the baseline week and week 4.

