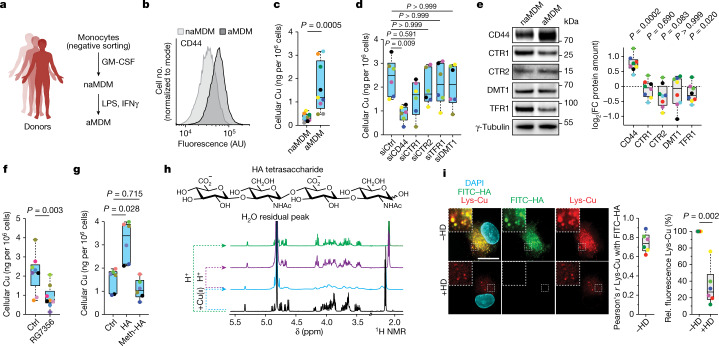
Fig. 1. CD44 mediates copper uptake.
a, Experimental setup used to generate inflammatory monocyte-derived macrophages (MDMs). b, Flow cytometry of CD44 in MDMs. Data are representative of n = 13 donors. AU, arbitrary units. c, ICP-MS of cellular copper in MDMs (n = 9 donors). d, ICP-MS of cellular copper in aMDMs with short interfering RNA (siRNA) knockdown of indicated receptors and transporters (n = 6 donors). Copper transporter 1 (CTR1) is encoded by SLC31A1, CTR2 is encoded by SLC31A2, transferrin receptor 1 (TFR1) is encoded by TFRC, and divalent metal transporter 1 (DMT1) is encoded by SLC11A2. siCtrl, control siRNA. e, Representative western blots of metal transporters in MDMs (n = 7 donors). FC, fold change. f, ICP-MS of cellular copper in MDMs treated with anti-CD44 antibody RG7356 during activation (n = 7 donors). g, ICP-MS of cellular copper in MDMs treated with hyaluronate (0.6–1 MDa) (HA) or permethylated hyaluronate (meth–HA) during activation (n = 6 donors). h, Molecular structure of hyaluronate tetrasaccharide (top) and 1H NMR spectra (bottom) of copper–hyaluronate complexation experiment, recorded at 310 K in D2O. i, Fluorescence microscopy of a lysosomal copper(ii) probe (Lys-Cu) and FITC–hyaluronate in aMDMs treated with hyaluronidase (HD). At least 30 cells were quantified per donor (n = 6 donors). Scale bar, 10 μm. Rel., relative. c,e,f,i, Two-sided Mann–Whitney test. d,g, Kruskal–Wallis test with Dunn’s post test. In all box plots in the main figures, boxes represent the interquartile range, centre lines represent medians and whiskers indicate the minimum and maximum values. In graphs, each coloured dot represents an individual donor for a given panel.

