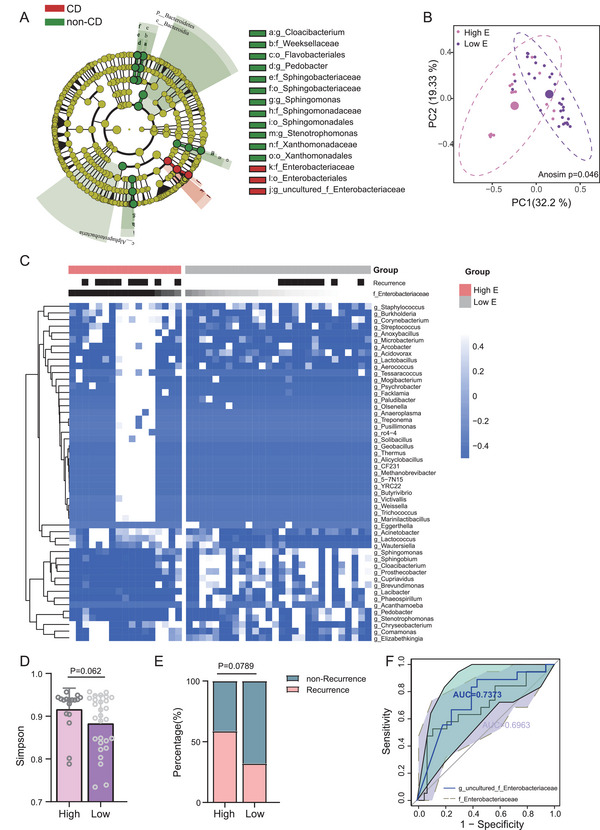
Figure 1.

Enterobacteriaceae are enriched in the mesenteric adipocytes tissue (MAT) of CD patients compared to the non‐CD controls. A) Differentially distributed taxa in MAT of CD patients (red) and the non‐CD controls (green) by linear discriminant analysis effect size (LEfSe) analysis (LDA ≥ 4). B) PCoA based on weighted UniFrac analysis of bacterial communities in MAT of CD patients with high E and low E. Analysis of similarities (Anosim) was employed to assess statistical significance between high E and low E. C) Heat map analysis revealed the differential distributed genera in MAT between CD patients with High E and Low E. D) Simpson index showed the alpha diversity between groups high E and low E. E) The distribution of patients with recurrence and non‐recurrence in groups High E and Low E. F) Receiver operating characteristic (ROC) analysis using f_Enterobacteriaceae and uncultured_f_ Enterobacteriaceae to classify patients with CD and the non‐CD controls. High E: high abundance of Enterobacteriaceae; Low E: low abundance of Enterobacteriaceae. Error bars ± SEM. *p < 0.05; **p < 0.01; ***p < 0.001; Mann–Whitney U‐test.
