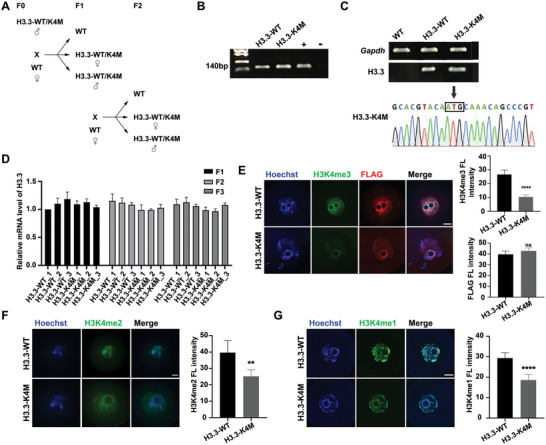
Figure 1.

Generation and verification of transgenic mouse models. A) Schematic illustration of breeding strategy. B) Representative genotyping results of H3.3‐WT, H3.3‐K4M, and WT mice. C) RT‐PCR combined with Sanger sequencing of PCR products proved the expression of H3.3‐K4M in the ovary of H3.3‐K4M transgenic mice. D) qRT‐PCR analysis of ovaries from F1, F2, and F3 generations at P14, and H3.3‐WT and H3.3‐K4M mice showed similar levels of exogenous H3.3 transcripts in ovaries. Data are presented as Mean ± SD (n = 3 for each group), ns p > 0.05. E–G) Immunofluorescence staining and fluorescence intensity quantification of H3K4me3 (E), FLAG (E), H3K4me2 (F), and H3K4me1 (G) in GV oocytes of H3.3‐WT and H3.3‐K4M transgenic mice. Scale bar = 10 µm. Data are presented as Mean ± SD (n = 8 for each group), ns p > 0.05, ****p < 0.0001, **p < 0.01.
