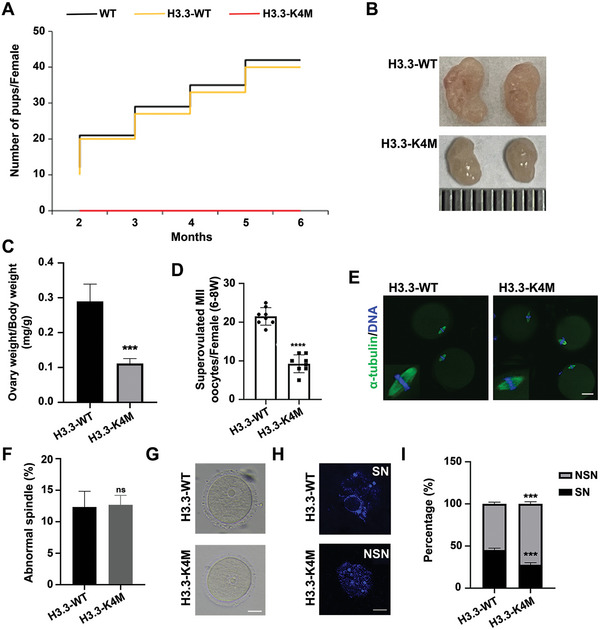
Figure 2.

H3.3‐K4M female mice were infertile and produced less mature oocytes. A) Cumulative numbers of pups per female of indicated genotypes. Note that H3.3‐K4M female mice were infertile. B,C) Representative bright field images of ovaries (left panel) and ovary/body weight ratio (right panel) of 2‐month‐old H3.3‐WT and H3.3‐K4M mice. Data are presented as Mean ± SD (n = 3 for each group), ***p < 0.001. D) The numbers of MII oocytes collected per adult female mice (6‐to‐8‐week) after superovulation. Data are presented as Mean ± SD (n = 8 for each group), ****p < 0.0001. E) Representative images of the spindle of MII oocytes derived from H3.3‐WT and H3.3‐K4M mice. Scale bar = 10 µm. F) The percent of abnormal spindle of MII oocytes derived from H3.3‐WT and H3.3‐K4M mice. Data are presented as Mean ± SD (n = 100 MII oocytes from each genotype), ns p > 0.05. G) Representative bright field images of GV oocytes from 2‐month‐old H3.3‐WT and H3.3‐K4M mice. Scale bar = 20 µm. H) Representative images of DAPI staining displaying the chromatin configuration of NSN and SN GV oocytes. Scale bar = 10 µm. I) Quantification of percentages of NSN and SN in H3.3‐WT (n = 145) and H3.3‐K4M (n = 136) GV oocytes from adult females (6–8 weeks). Data are presented as Mean ± SD (n = 8 for each group), ***p < 0.001.
