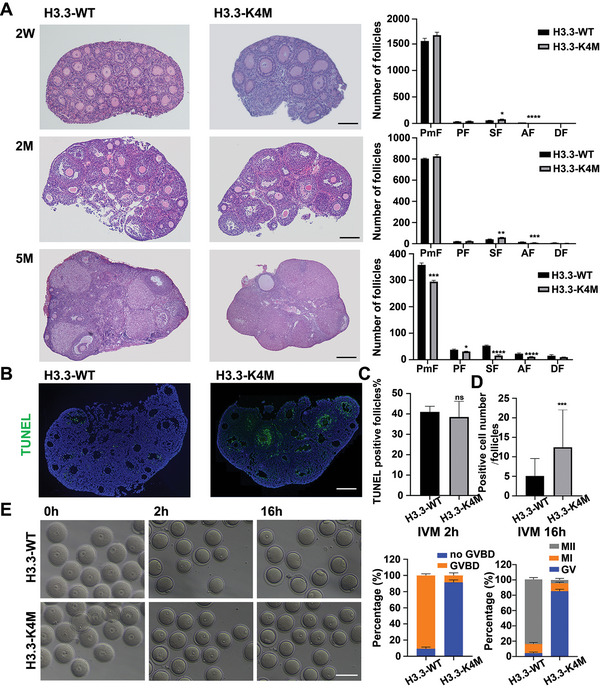
Figure 3.

Follicle development and oocyte maturation were disturbed in H3.3‐K4M mice. A) Hematoxylin/eosin staining of the paraffin slides showing the morphologies of ovaries from 2‐week(2W), 2‐month(2M), and 5‐month(5M)‐old H3.3‐WT and H3.3‐K4M mice. Statistical analysis of the numbers of follicles in the ovaries of H3.3‐WT and H3.3‐K4M transgenic mice are shown in right. Data are presented as Mean ± SD (n = 3 for each group), *p < 0.05, **p < 0.01, ***p < 0.001, ****p < 0.0001. B) TUNEL assay of paraffin slides of ovaries from 2‐month‐old H3.3‐WT and H3.3‐K4M mice, Scale bar = 200 µm. C,D) Statistical analysis of the TUNEL assay was performed. Data are presented as Mean ± SD, n = 3 for each group, ns p > 0.05, ***p < 0.001. E) GVBD ratio and maturation ratio of H3.3‐WT and H3.3‐K4M oocytes after IVM for 2 or 16 h. Left panel shows representative bright field images of H3.3‐WT and H3.3‐K4M oocytes after IVM for 2 or 16 h. Scale bar = 200 µm. Right panels show the quantification of the GVBD ratio and maturation ratio for H3.3‐WT (n = 50 for each group) and H3.3‐K4M (n = 50 for each group) GV oocytes from ovaries of 6‐to‐8‐week mice.
