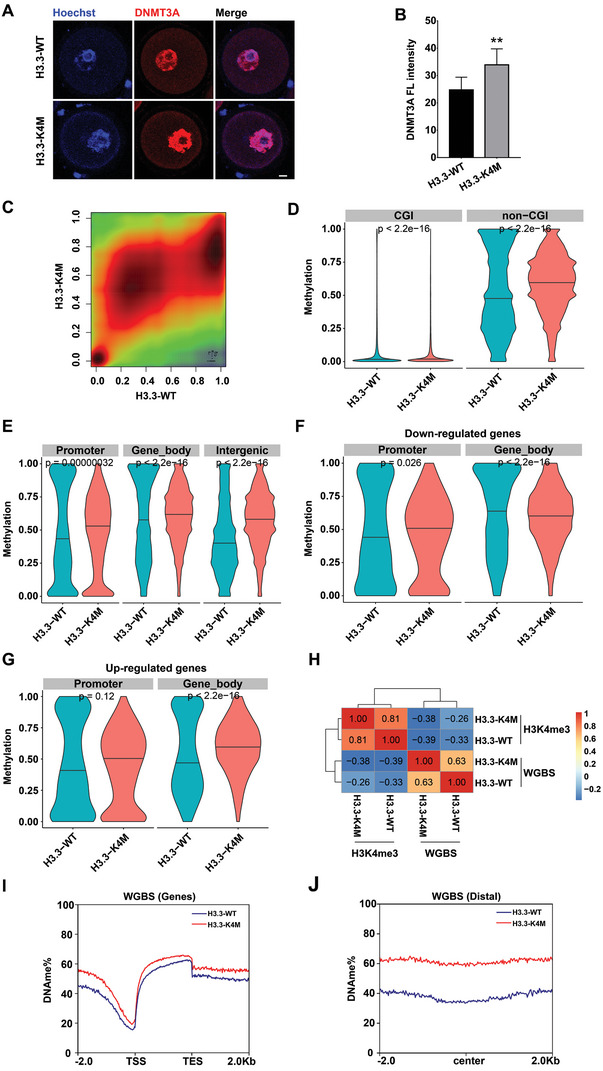
Figure 5.

Increase of DNA methylation in H3.3‐K4M oocytes. A) Immunofluorescence staining and B) the fluorescence intensities of DNMT3A in H3.3‐WT and H3.3‐K4M GV oocytes. Scale bar = 10 µm. Data are presented as Mean ± SD, n = 18 GV oocytes derived from each genotype, **p < 0.01. C) Smooth scatter plot shows CpG methylation levels in H3.3‐WT and H3.3‐K4M GV oocytes. D) Violin plot shows alterations of DNA methylation at CGI and non‐CGI in H3.3‐WT and H3.3‐K4M GV oocytes. p values by Wilcoxon Test. E) Violin plot shows alterations of DNA methylation at gene feature regions, including promoter, gene body, and intergenic region, with black horizontal lines indicating the median. p values by Wilcoxon Test. F) Violin plot shows alterations of DNA methylation at gene feature regions of down‐regulated genes, including promoter, gene body, and intergenic region, with black horizontal lines indicating the median. p values by Wilcoxon Test. G) Violin plot shows alterations of DNA methylation at gene feature regions of up‐regulated genes, including promoter, gene body, and intergenic region, with black horizontal lines indicating the median. p values by Wilcoxon Test. H) Pearson correlation coefficient of H3K4me3 enrichment and DNA methylation at gene promoter regions in H3.3‐WT and H3.3‐K4M oocytes. Read density plot showing the percentage of DNA methylation at I) genic and J) distal regions in H3.3‐WT and H3.3‐K4M oocytes.
