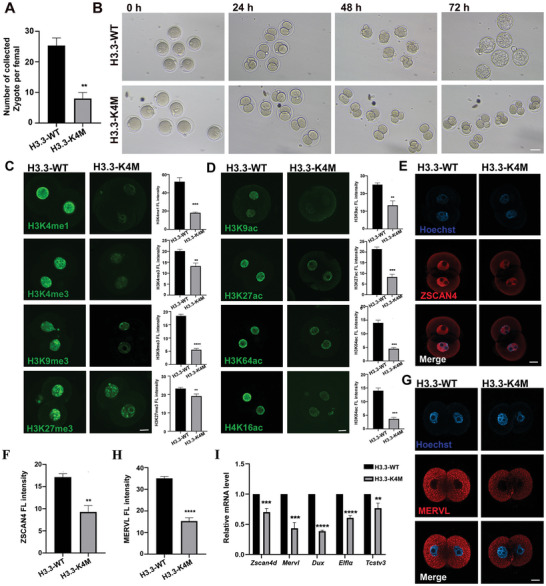
Figure 8.

Early embryonic developmental arrest of H3.3‐K4M embryos. A) The numbers of zygotes per adult female mice (6‐to‐8‐week) after superovulation. Data are presented as Mean ± SD (n = 8), **p < 0.01. B) Representative bright field images of the early development of embryos by mating H3.3‐WT/K4M female with WT male for zygote collection and culturing for 24, 48, and 72, respectively. Scale bar = 50 µm. C,D) Immunofluorescence staining and fluorescence intensity quantification of histone methylation (C) and histone acetylation (D) in 2‐cell embryos derived from H3.3‐WT and H3.3‐K4M transgenic mice. Scale bar = 10 µm. Data are presented as Mean ± SD, n = 10 2‐cell embryos were derived from each genotype, *p < 0.05, **p < 0.01, ***p < 0.001, ****p < 0.0001. E) Immunofluorescence staining of ZSCAN4 in 2‐cell embryos from H3.3‐WT and H3.3‐K4M female. Scale bar = 10 µm. F) Quantification of fluorescence intensity of ZSCAN4 in 2‐cell embryos from H3.3‐WT and H3.3‐K4M females. Data are presented as Mean ± SD, n = 10 2‐cell embryos were derived from each genotype, **p < 0.01. G) Immunofluorescence staining of MERVL in 2‐cell embryos of H3.3‐WT and H3.3‐K4M female. Scale bar = 10 µm. H) Quantification of fluorescence intensity of MERVL in 2‐cell embryos of H3.3‐WT and H3.3‐K4M female. Data are presented as Mean ± SD, n = 10 2‐cell embryos were derived from each genotype, ****p < 0.0001. I) The relative mRNA levels of Zscan4d, Mervl, Dux, Eif1a, and Tcstv3 by RT‐qPCR in 2‐cell embryos derived from H3.3‐WT and H3.3‐K4M female. Data are presented as Mean ± SD, n = 10 2‐cell embryos were derived from each genotype, **p < 0.01, ****p < 0.0001.
