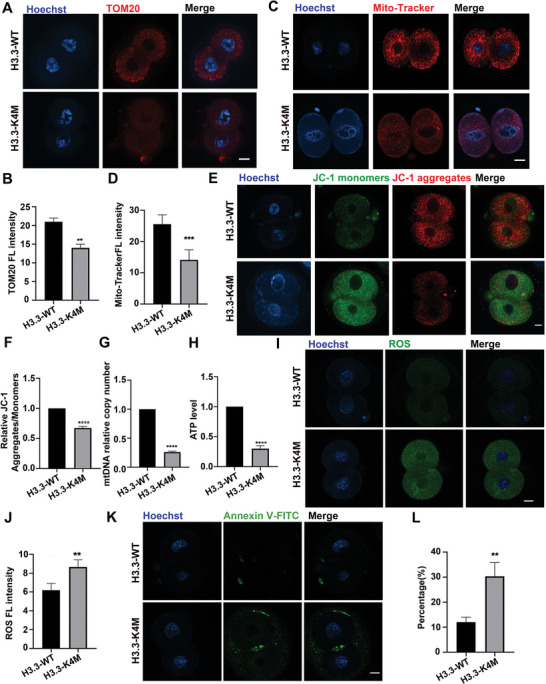
Figure 9.

Mitochondrial dysfunction in H3.3‐K4M embryos. A) Immunofluorescence staining of TOM20 in H3.3‐WT and H3.3‐K4M 2‐cell embryos. Scale bar = 10 µm. B) Fluorescence intensity quantification of TOM20 in H3.3‐WT and H3.3‐K4M 2‐cell embryos. Data are presented as Mean ± SD, n = 10 2‐cell embryos were derived from each genotype, **p < 0.01. C) H3.3‐WT and H3.3‐K4M 2‐cell embryos were labeled with Mito‐Tracker Red to visualize active mitochondria. Scale bar = 10 µm. D) Fluorescence intensity quantification of Mito‐Tracker Red in H3.3‐WT and H3.3‐K4M 2‐cell embryos. Data are presented as Mean ± SD, n = 10 2‐cell embryos were derived from each genotype, ***p < 0.001. E) Representative images of mitochondrial membrane potential assessed by JC‐1 dye. Scale bar = 10 µm. F) Histogram showing the JC‐1 aggregates/monomers fluorescence ratio. Data are presented as Mean ± SD, n = 10 2‐cell embryos were derived from each genotype, ****p < 0.0001. G) The relative mtDNA copy numbers in H3.3‐WT and H3.3‐K4M 2‐cell embryos. Data are presented as Mean ± SD, n = 10 2‐cell embryos were derived from each genotype, ****p < 0.0001. H) Quantitative analysis of the relative ATP levels in H3.3‐WT and H3.3‐K4M 2‐cell embryos. Data are presented as Mean ± SD, n = 10 2‐cell embryos were derived from each genotype, ****p < 0.0001. I) H3.3‐WT and H3.3‐K4M 2‐cell embryos were labeled with DCFH‐DA to visualize ROS level. Scale bar = 10 µm. J) The fluorescence intensity of ROS in H3.3‐WT and H3.3‐K4M 2‐cell embryos. Data are presented as Mean ± SD, n = 10 2‐cell embryos were derived from each genotype, **p < 0.01. K) H3.3‐WT and H3.3‐K4M 2‐cell embryos were labeled with Annexin‐V‐FITC to visualize apoptosis level. Scale bar = 10 µm. L) The percent of Annexin‐V‐FITC positive 2‐cell embryos from H3.3‐WT and H3.3‐K4M female. Data are presented as Mean ± SD, n = 10 2‐cell embryos were derived from each genotype, **p < 0.01.
