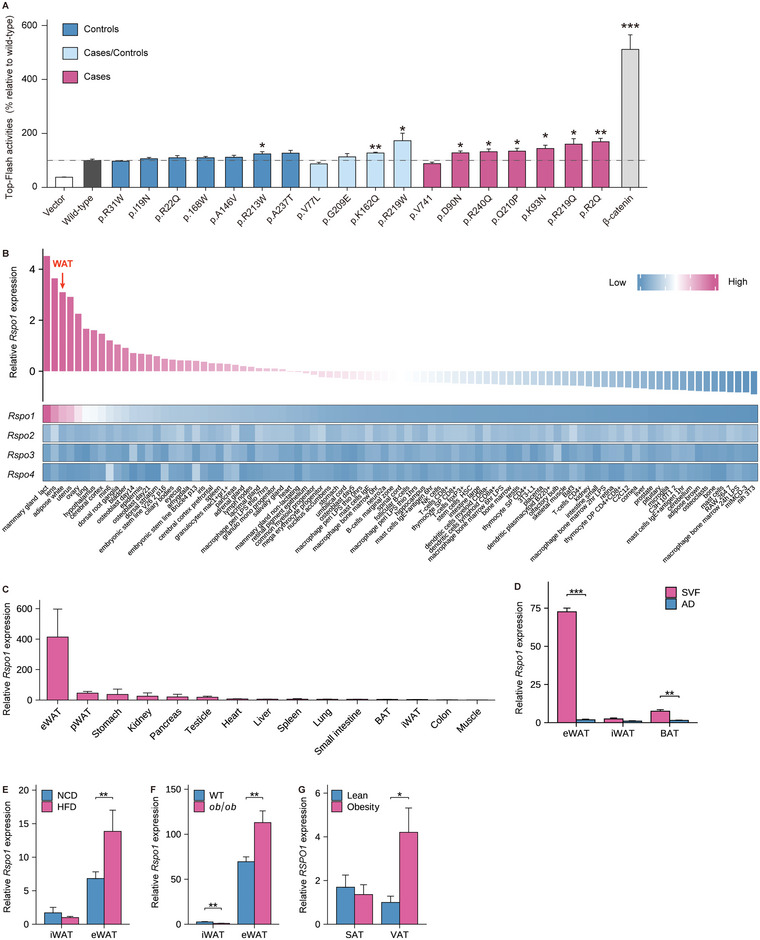
Figure 1.

RSPO1 is enriched in visceral fat and increases with adiposity. A) TOP‐Flash luciferase reporter assay of HEK293T cells transfected with plasmids of wild‐type RSPO1 and 18 rare/low‐frequency RSPO1 nonsynonymous variants described in Table 1, respectively. β‐catenin plasmids were applied as positive control (n = 5 per group). Statistical significances were calculated between wild‐type and each variant using unpaired Student's t‐test. B) Heat map representing the expression of mouse Rspo1/2/3/4 in diverse tissues and cell lines, as analyzed using a publicly available microarray data set (GSE10246). C) Quantitative PCR validation of Rspo1 expression in multiple tissues of 8‐week‐old male C57BL/6J mice (n = 3–6 per group). D) Rspo1 mRNA expression in the stromal vascular fractions (SVF) and mature adipocytes (AD) of eWAT, iWAT, and BAT, respectively (n = 3 per group). E,F) Rspo1 mRNA expression in iWAT and eWAT of mice fed normal chow diet (NCD) and high‐fat diet (HFD) (n = 13–16 per group) (E), or in that of wild‐type (WT) and ob/ob mice (n = 10 per group) (F). G) RSPO1 mRNA expression in the subcutaneous adipose tissue (SAT) and visceral adipose tissues (VAT) of obese subjects versus normal weight controls (n = 10–17 per group). eWAT, epididymal white adipose tissue; pWAT, pararenal white adipose tissue; iWAT, inguinal white adipose tissue; BAT, brown adipose tissue. SAT, subcutaneous adipose tissue; VAT, visceral adipose tissue. Data are shown as the mean ± sem. p values were calculated using unpaired Student's t‐test. *p < 0.05; **p < 0.01; ***p < 0.001.
