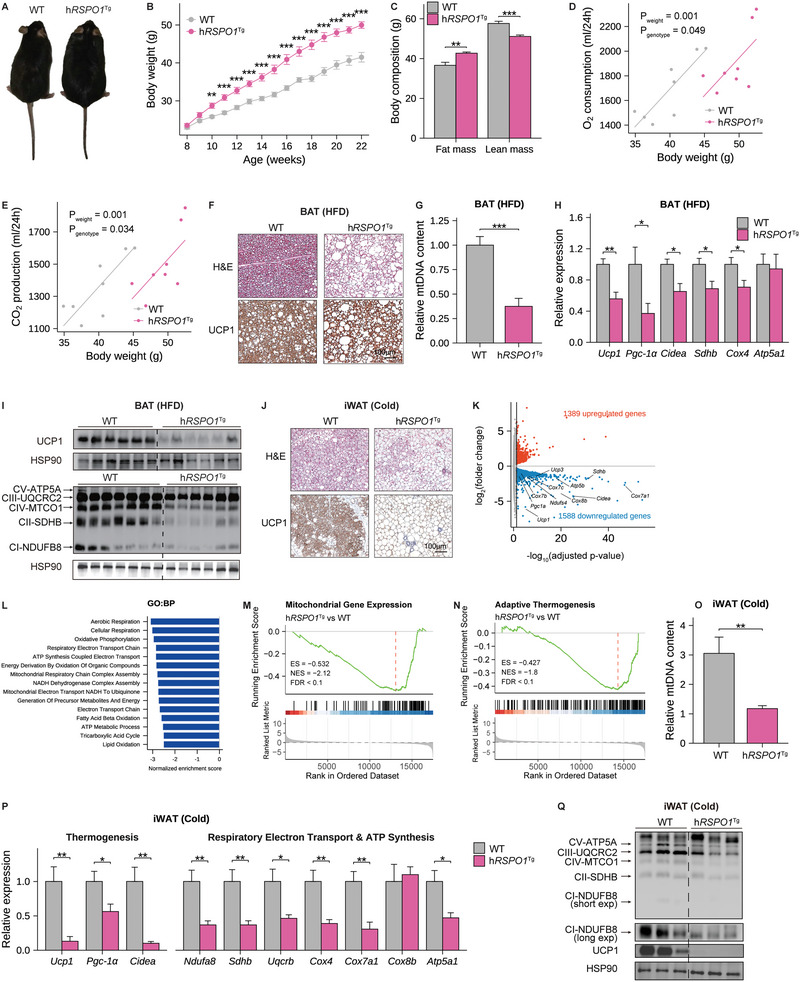
Figure 2.

Human RSPO1 overexpression promotes diet‐induced obesity by suppressing adipose thermogenesis. A–C) A representative global image (A), body weight curve (B), and body composition (C) of human RSPO1 transgenic (hRSPO1 Tg) and WT littermate mice fed HFD for 14 weeks (n = 8 per group). D,E) ANCOVA analysis of 24‐hour O2 consumption (D) and CO2 production (E) with body weight as a covariate in HFD‐fed WT and hRSPO1 Tg mice (n = 8 per group). F) Representative images of H&E staining and UCP1 immunohistochemical staining of BAT in HFD‐fed WT and hRSPO1 Tg mice (n = 4 per group). Scale bar, 100 µm. G) The mitochondrial DNA (mtDNA) content of BAT in HFD‐fed WT and hRSPO1 Tg mice (n = 6–7 for per group). H,I) Quantitative PCR analysis (H) and Western blotting (I) of mitochondrial respiratory complexes and thermogenic genes in BAT of HFD‐fed WT and hRSPO1 Tg mice (n = 6–7 per group). J) Representative images of H&E staining and UCP1 immunohistochemical staining in iWAT of WT and hRSPO1 Tg mice exposed to chronic cold stimulation (4 °C) for 10 days (n = 4 per group). Scale bar, 100 µm. K) The volcano plot of genes differentially expressed in iWAT of hRSPO1 Tg versus WT mice under chronic cold stimulation (n = 3 per group). Biomarkers associated with mitochondrial functions were indicated. L) The top‐downregulated (FDR < 0.05) pathways revealed by GSEA based on GO:BP database in iWAT of hRSPO1 Tg versus WT mice under chronic cold stimulation. (M) and (N) GSEA results of mitochondrial gene expression (M) and adaptive thermogenesis (N) in iWAT of hRSPO1 Tg versus WT mice under chronic cold stimulation. O–Q) Relative mtDNA content (O), quantitative PCR analysis (P), and Western blotting analysis (Q) of mitochondrial respiratory complexes and thermogenic genes in iWAT of hRSPO1 Tg and WT mice under chronic cold stimulation (n = 7–8 per group). Data are shown as the mean ± sem, and statistical differences between genotypes were assessed by unpaired Student's t‐test (B,C,G,H,O,P); FDR below 0.05 was considered as the criteria for evaluating differentially expressed genes between genotypes (K); FDR below 0.1 was considered as statistical significance in GSEA (L–N). *p < 0.05; **p < 0.01; ***p < 0.001.
