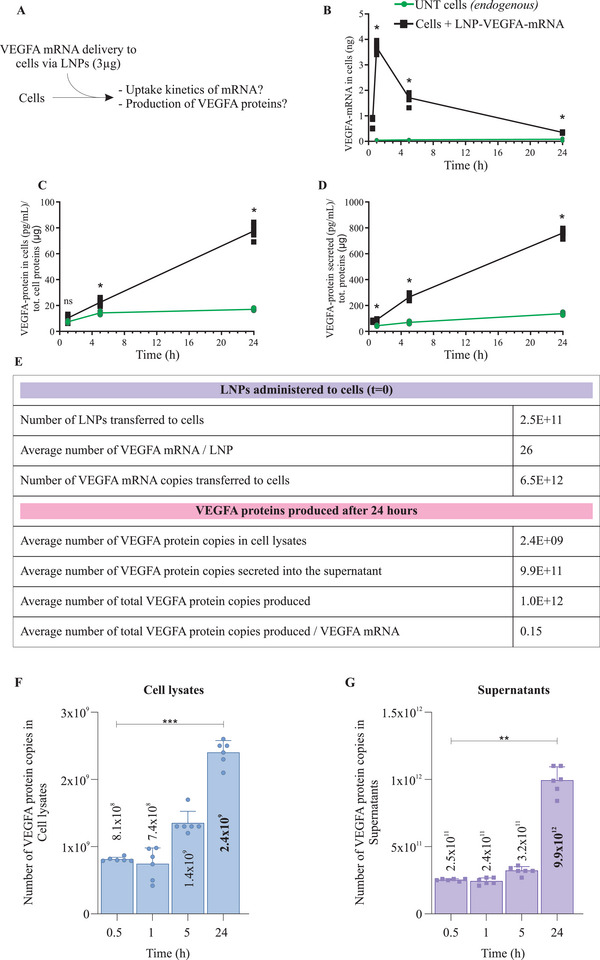
Figure 2.

Delivery of VEGF‐A mRNA via Lipid Nanoparticles (LNPs) and kinetics of cellular uptake of mRNA. A) A schematic representation of cellular delivery of LNPs containing chemically modified VEGF‐A mRNA, and uptake kinetics of LNP‐mRNA. A 3 µg of VEGF‐A mRNA was delivered via LNPs. B) Detection and quantification of LNP‐VEGF‐A mRNA inside HTB‐177 cells at different time points (n = 6). C) Detection and quantification of newly produced VEGF‐A protein in cell lysate, following the delivery of 3 µg VEGF‐A mRNA via LNPs (n = 6). D) Levels of VEGF‐A protein secreted into the extracellular space (detected in supernatants, n = 6). For B–D), the Mann‐Whitney U‐test was applied to compare untreated and treated samples for each time point, separately. Significant differences (*p < 0.05) between LNP‐treated and untreated cells were observed at 1 h, 5 h, and 24 h. ns = no significant differences. E) Stoichiometric quantification of total numbers of LNPs, total VEGF‐A mRNA copies administered to cells (time t0), and the number of VEGF‐A mRNA copies delivered per LNP (time t0). After 24 h of LNP delivery, the VEGF‐A protein copies produced from delivered LNP‐VEGF‐A mRNA were calculated (n = 6). F) Copy numbers of VEGF‐A protein quantified in cell lysates and G) in supernatants of HTB‐177 cells treated with LNP‐VEGF‐A mRNA (n = 6). Statistically significant differences for cells and supernatants were separately evaluated by the Kruskal‐Wallis test followed by Dunn's multiple comparison test to 0.5 h (**p < 0.01, ***p < 0.001; blank = no significant differences). UNT, untreated.
