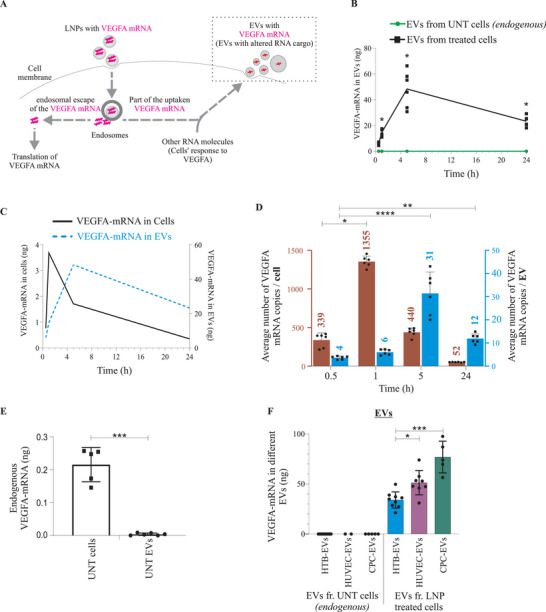
Figure 4.

VEGF‐A mRNA of lipid nanoparticles (LNPs) is secreted into extracellular vesicles (EVs). A) Schematic illustration for the investigation of the intracellular fate of LNP‐VEGF‐A mRNA and secretion of VEGF‐A mRNA into EVs. B) Detection and quantification of VEGF‐A mRNA in EVs secreted from LNP‐treated HTB‐177 cells (exogenous), and untreated cells (endogenous) (n = 6). C) Overlapping and time‐lapsed analysis of the intracellular detection of LNP‐VEGF‐A mRNA, with relation to its incorporation into EVs (n = 6). D) Number of VEGF‐A mRNA copies quantified in EVs and their parental cells at different time points (n = 6). Using LNPs, cells were treated with 3 µg (6.5 × 10¹² copies) of VEGF‐A mRNA which was loaded in 2.5 × 10¹¹ LNPs (i.e., 26 copies per LNP). On average 1355 VEGF‐A mRNA copies per cell (after 1 h, the peak), and 31 VEGF‐A mRNA copies/EV (after 5 h, the peak) were detected. Out of 6.5 × 10¹² copies of VEGF‐A mRNA administered via LNPs to cells, only 2186 and 53 VEGF‐A mRNA copies per cell and EV, respectively, were detected. Statistically significant differences over time for cells and EVs were evaluated separately by the Kruskal‐Wallis test followed by Dunn's multiple comparison test to 0.5 h (*p < 0.05, **p < 0.01, ****p < 0.0001; ns = no significant differences). E) Levels of endogenous VEGF‐A mRNA in untreated cells and their secreted EVs (n = 5 cells, n = 8 EVs). Statistically significant differences between cells and EVs were evaluated by the Mann‐Whitney U‐test (***p < 0.001). F) Comparison of LNP‐VEGF‐A mRNA in EVs secreted from HTB cells (n = 10 for UNT (untreated), n = 9 for treated), HUVECs (n = 2 for UNT, n = 8 for treated), and CPCs (n = 4 for UNT, n = 5 for treated). Statistically significant differences in treated cells were evaluated by the Kruskal‐Wallis test followed by Dunn's multiple comparison test (*p < 0.05; ***p < 0.001; ns = no significant differences). Dots in the plots represent the distribution of individual samples. UNT EVs, EVs from untreated cells.
