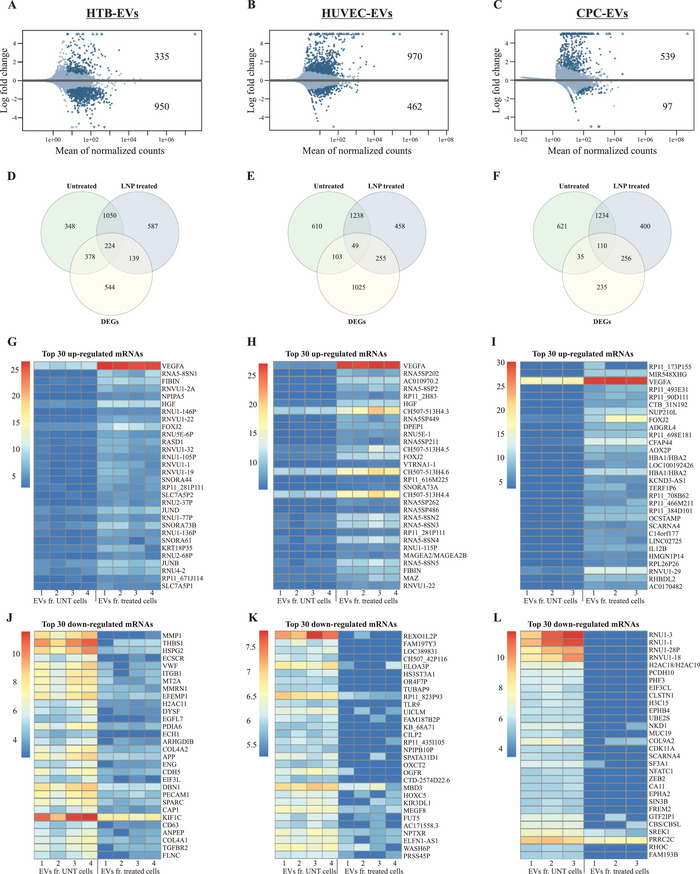
Figure 8.

Endogenous genes are deregulated after lipid nanoparticle (LNP) treatment and are secreted into extracellular vesicles (EVs). The top panel shows MA plots of DEGs in EVs from A) HTB cells (n = 4), B) HUVECs (n = 4), and C) CPCs (n = 4) after LNP treatment. Dark blue dots represent significant DEGs (p < 0.05). The Venn diagrams in the middle panel show the intersection of the 2000 most highly expressed genes (using mean of replicates) in untreated and LNP‐treated samples, and the total number of identified DEGs in D) HTB‐, E) HUVEC‐, and F) CPC‐EVs. The heatmaps in the bottom panel represent normalized expression values (rows as genes and columns as samples) of the 30 most G–I) upregulated and J–L) downregulated genes, selected based on fold change (logFC). Shrunken logFC values are used for the visualizations in MA plots and heatmaps, and standard logFC values are used for the Venn diagrams.
