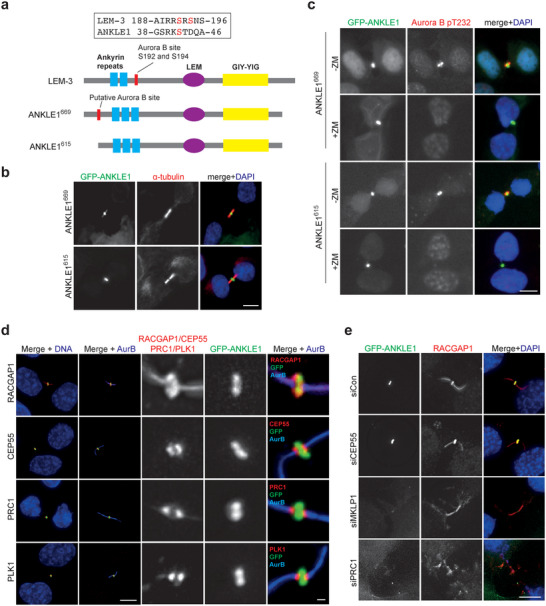
Figure 1.

Localization of ANKLE1 at the midbody. a) Schematic representation of the domain structure of LEM‐3 and ANKLE1 (two isoforms: 669 aa and 615 aa). The blue rectangles, purple ellipse, and yellow rectangle represent the ankyrin repeats, LEM domain, and GIY‐YIG nuclease domain, respectively. The putative Aurora B sites are marked by the red rectangles. b) U2OS cells stably expressing GFP‐ANKLE1669 and GFP‐ANKLE1615 were fixed for immunofluorescence. GFP (green), α‐tubulin (red) and DNA (blue) were visualized. c) GFP‐ANKLE1 expressing cells were treated with DMSO or ZM447439 (10 × 10−6 m) for 15 min. GFP (green), phosphorylation of Aurora B at T232 (red), and DNA (blue) were visualized. d) GFP‐ANKLE1 expressing cells were fixed for immunofluorescence. GFP (green), different midbody proteins (RACGAP1, CEP55, PRC1 or PLK1 in red) and DNA (blue) were visualized. e) GFP‐ANKLE1 expressing cells were treated with the indicated siRNAs for 48 h before fixed for immunofluorescence. GFP (green), RACGAP1 (red) and DNA (blue) were visualized. Scale bars, 10 µm or 1 µm (inset).
