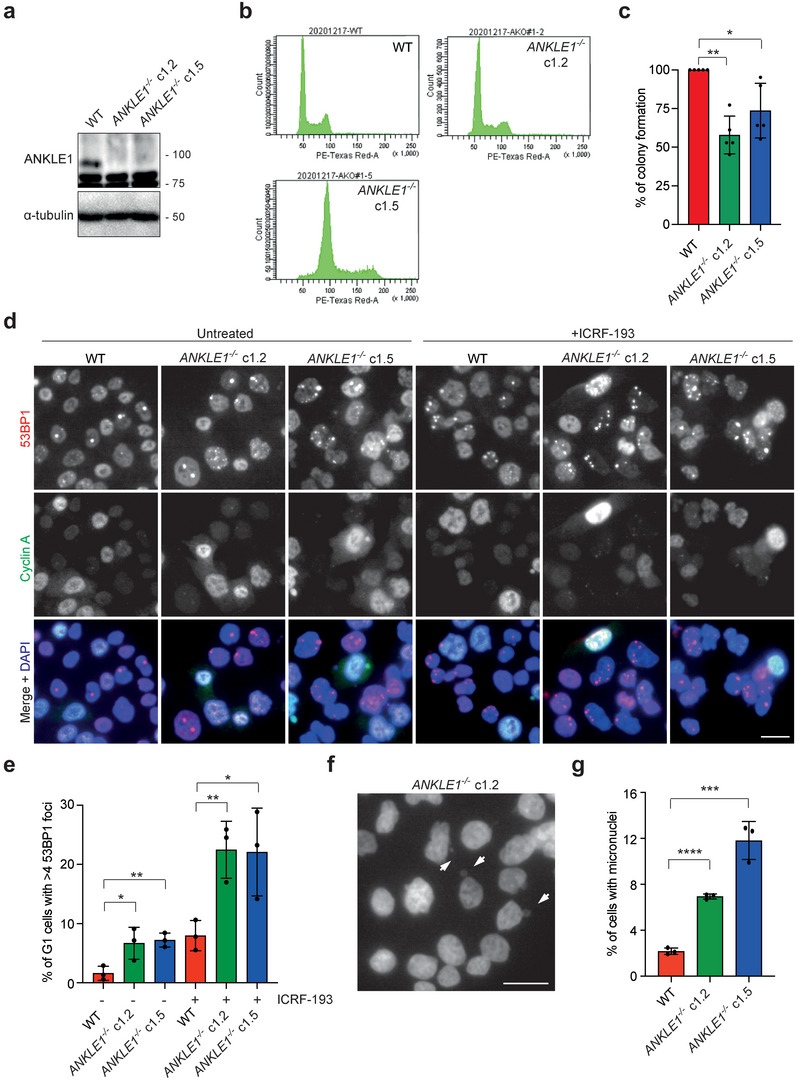
Figure 2.

ANKLE1−/− knockout cells display increased levels of DNA damage and micronuclei. a) Cell extracts of parental HCT116, and two clones of ANKLE1−/− cells (c1.2 and c1.5) were analyzed by western blotting for the indicated proteins. b) Cell cycle profiles of wild‐type and ANKLE1−/− cells analyzed by FACS. c) Clonogenic cell survival assay was carried out on wild‐type and ANKLE1−/− cells. Bars represent mean ± SD of n = 5 independent experiments. d) HCT116 wild‐type and ANKLE1−/− cells were treated with ICRF‐193 (100 × 10−6 m) for 16 h before fixed for immunofluorescence. 53BP1 (red), Cyclin A (green) and DNA (blue) were visualized. Scale bar, 10 µm. e) Quantification of G1 cells (>700 cells per condition) with more than four 53BP1 foci. Bars represent mean ± SD of n = 3 independent experiments. f) Representative image of ANKLE1−/− cells, arrows point to micronuclei. Scale bar, 20 µm. g) Quantification of cells with micronuclei (> 700 cells per condition). Bars represent mean ± SD of n = 3 independent experiments. *p < 0.05; **p < 0.01; ***p < 0.001; ****p < 0.0001; statistical significance values were determined with unpaired two‐tailed t‐tests.
