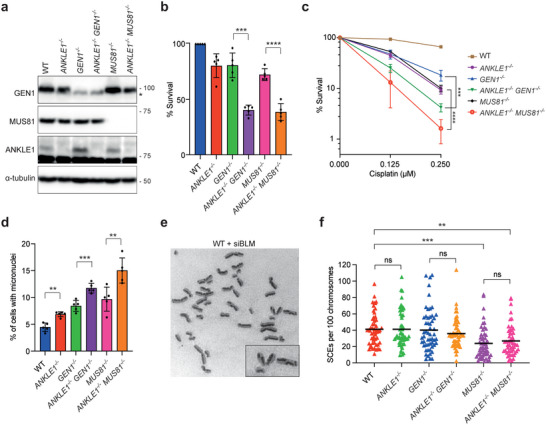
Figure 7.

ANKLE1 does not act in parallel to MUS81 and GEN1 in processing recombination intermediates. a) Cell extracts of HCT116 wild‐type, single knockout (ANKLE1−/− , GEN1−/− and MUS81−/− ) and double knockout (ANKLE1−/−/GEN1−/ − and ANKLE1−/−/MUS81−/− ) cells were analyzed by western blotting for the indicated proteins. The asterisk indicates a cross‐reactive band in GEN1 western blot. b) Clonogenic survival assay was carried out on the indicated cell lines in untreated condition. Bars represent mean ± SD of n = 5 independent experiments. Statistical significance values were determined with unpaired two‐tailed t‐tests. c) Clonogenic survival assay was carried out on the indicated cell lines upon treatment of the indicated concentrations of cisplatin. Graph shows mean ± SD of n = 3 independent experiments. Statistical significance values were determined with two‐way ANOVA. d) Quantification of cells with micronuclei (>3000 cells per condition). Bars represent mean ± SD of n = 5 independent experiments. Statistical significance values were determined with unpaired two‐tailed t‐tests. e) Representative image of metaphase spread from BLM‐depleted cells showing examples of chromosomes with SCE. f) Quantification of SCE formation in wild‐type, single‐knockout and double‐knockout cells depleted of BLM. At least 50 metaphase cells (>2000 chromosomes) were counted per condition. Statistical significance values were determined with unpaired two‐tailed t‐tests. Black lines represent the mean numbers of SCEs per 100 chromosomes per spread. **p < 0.01; ***p < 0.001; ****p < 0.001; ns = not significant.
