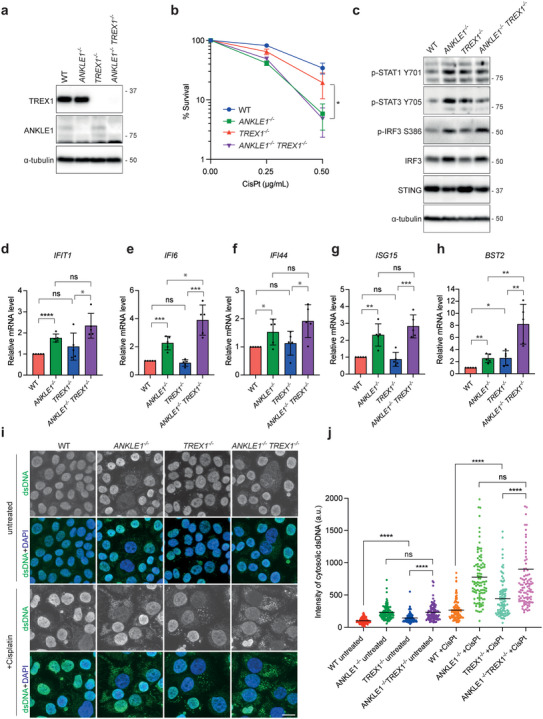
Figure 8.

ANKLE1 deficiency induces the activation of the cGAS‐STING pathway. a) Cell extracts of HCT116 wild‐type, ANKLE1−/−, TREX1−/− and ANKLE1−/−/TREX1−/− cells were analyzed by western blotting for the indicated proteins. b) Clonogenic survival assay was carried out on cells treated with the indicated concentrations of cisplatin. Graph shows mean ± SD of n = 3 independent experiments. Statistical significance values were determined with two‐way ANOVA. c) Cell extracts were analyzed by western blotting for the indicated proteins. d–h) Relative mRNA levels of the indicated ISGs in cells normalized to untreated HCT116 wild‐type. Bars represent mean ± SD of n = 5 independent experiments. Statistical significance values were determined with unpaired two‐tailed t‐tests. i) Cells were untreated or treated with cisplatin (0.5 µg mL−1, 3 days) and fixed for immunofluorescence. dsDNA (green) and DNA (blue) were visualized. Scale bars, 10 µm. j) Quantification of the signal intensities of the cytoplasmic staining of dsDNA. Intensity of cytosolic dsDNA of a cell is calculated as: the total intensity of dsDNA staining of the whole cell minus the intensity of dsDNA staining in the nucleus. n = 100 cells were measured per condition. Statistical significance values were determined with unpaired two‐tailed t‐tests. Black lines represent the means in arbitrary unit (a.u.). *p < 0.05; **p < 0.01; ***p < 0.001; ****p < 0.0001; ns = not significant.
