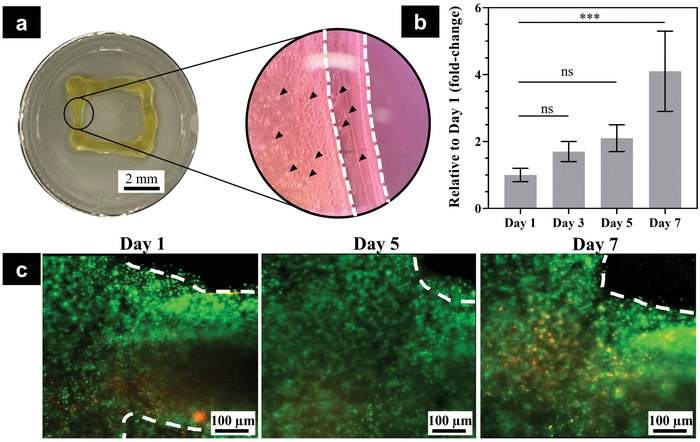
Figure 8.

F3DB supported extrusion‐based cell bioprinting as potential in situ bioprinting. a) Representative image of the printed construct at a macro scale (left) and microstructure of printed construct using phase‐contrast microscopy (right). Note that the white dashed lines showed printed layers and black arrows represented cells in the printed structure. b) Cell metabolic activity expressed as fold‐change relative to day 1 postprinting. The data are presented as mean ± standard deviation (n = 4). c) Representative images of live/dead staining. Live cells are green and dead cells are red.
