
Figure 4.
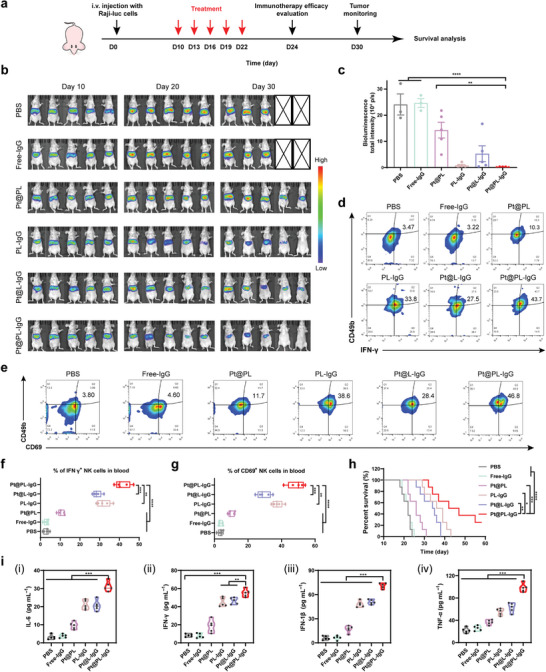
In vivo therapeutic efficacy and activation of the immune response with the ITHAP strategy on disseminated xenograft lymphoma in nude mice. a) Illustration of the experimental protocol in disseminated xenograft lymphoma in nude mice. b,c) In vivo bioluminescence imaging (b) and quantification (day 30) (c) in nude mice with different treatments (n = 5). d,f) Representative flow cytometry plots (d) and quantification (f) of the population of IFN‐γ + NK cells in peripheral blood. e, g) Representative flow cytometry plots (e) and quantification (g) of the population of CD69+ NK cells in peripheral blood. h) The survival ratio of disseminated lymphoma mice with different treatments (n = 8). i) The levels of the serum cytokines (IL‐6, IFN‐γ, IFN‐1β, and TNF‐α) by ELISA (n = 5). Data are shown as mean ± SD; n represents the number of biologically independent samples. Student's t‐test. *P < 0.05, **P < 0.01 and ***P < 0.001 and ****P < 0.0001.