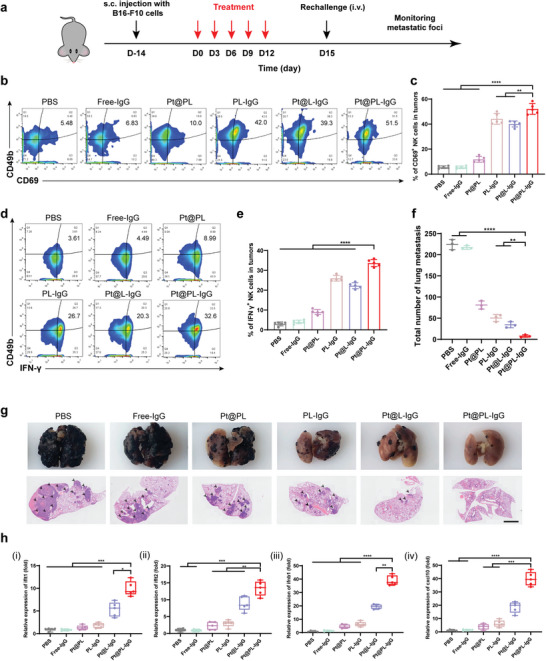
Figure 6.

In vivo therapeutic efficacy and activation of the immune response with the ITHAP strategy in metastatic melanoma mice. a) Illustration of the experimental protocol in the metastatic melanoma mice model. b, c) Representative flow cytometry plots (b) and quantification (c) of the population of CD69+ NK cells in tumors (n = 5). d, e) Representative flow cytometry plots (d) and quantification (e) of the population of IFN γ + NK cells in tumors (n = 5). f) Quantitative analysis of the number of metastatic nodules in the lungs on day 30 (n = 3). g) Representative images and H&E staining of the lungs after different treatments. Scale bar, 2 mm. h) Relative expression of the cGAS‐STING axis (ifit1, ifit1, ifnb1, and cxcl10) in B16‐F10 tumors‐bearing mice after different treatments by RT‐qPCR (n = 5). Data are shown as mean ± SD; n represents the number of biologically independent samples. Student's t‐test. *P < 0.05, **P < 0.01 and ***P < 0.001 and ****P < 0.0001.
