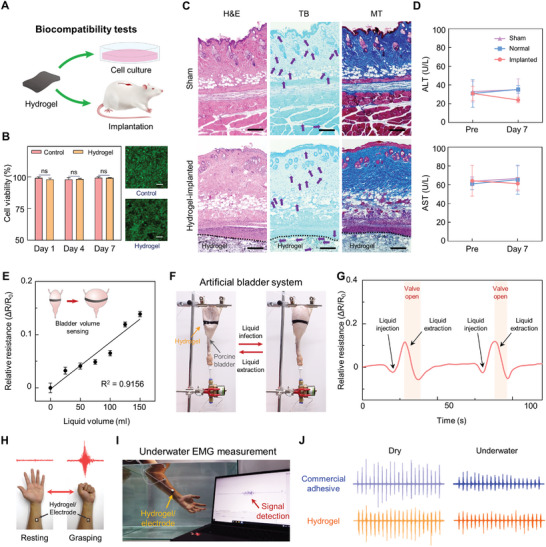
Figure 6.

Biocompatibility and bioelectronic applications of the hydrogel. A) In vitro and In vivo biocompatibility of the hydrogel. B) Statistical analysis of in vitro biocompatibility test of the hydrogel (ns: no significant differences; n = 4: n is the sample size for each group) and the representative fluorescent images after 7 days (scale bar: 50 µm). The statistical analysis was conducted with an unpaired t‐test (*P < 0.05, **P < 0.01, ***P < 0.001, and ****P < 0.0001; ns: no significant difference). C) Representative histological images stained with hematoxylin and eosin (H&E), Masson's trichrome (MT), and Toluene blue (TB) for assessment of the biocompatibility of the hydrogel in vivo after 3 days of subcutaneous implantation (scale bars = 50 µm). Purple arrows indicate mast cells. D) Serum levels of Aspartate aminotransferase (AST) and alanine aminotransferase (ALT) before (Pre) and at 7 days after the implantation of the hydrogel (n = 6 for the implanted group and n = 3 for the sham and normal groups: n is the sample size for each group). The statistical analysis was conducted by using an unpaired t‐test. E) Relative resistances of the hydrogel attached to the ex vivo porcine bladder as a function of injected liquid volume within the bladder (n = 10: n is the sample size for each volume point). F) Photograph of an artificial bladder system capable of injecting and extracting liquids. G) Real‐time resistive responses of the hydrogel on the porcine bladder in which liquid injection and extraction are controlled. H) An optical image of the hydrogel detecting the EMG signal from a grasping human hand. I) Photograph of underwater EMG signal detection. J) Measured EMG signals with commercial adhesive and the developed hydrogel under dry conditions and underwater.
