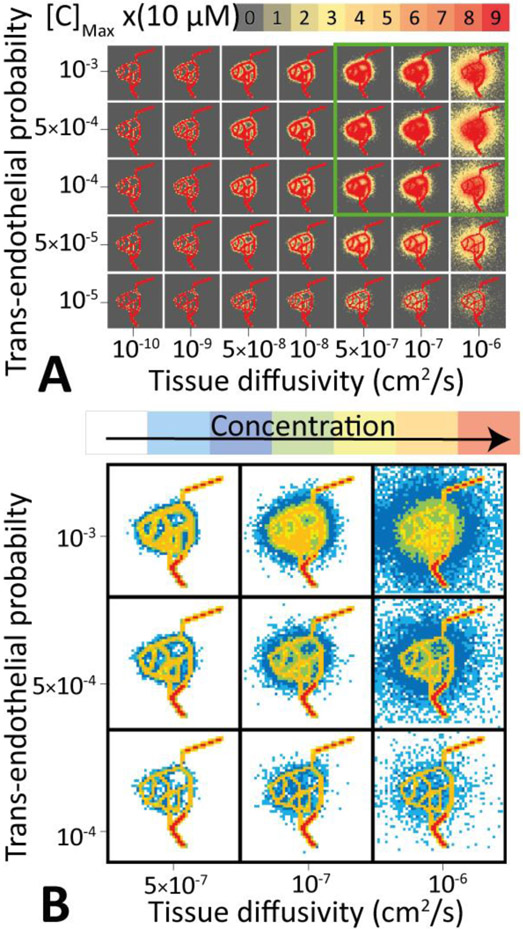
Figure 4 ∣. Three-dimensional final distribution of drugs in tumor tissues as a function of the trans-endothelial transport probability and tissue diffusivity of drugs in the tumor.
A: A heat map plot shows the drug concentration inside the tissue and vasculature for a range of trans-endothelial transport probabilities and tissue diffusivities. The optimal range of parameters is highlighted by a green box. B: Analysis of the drug distribution across the tumor tissue allows precise spatial mapping of the therapeutic efficiency.

