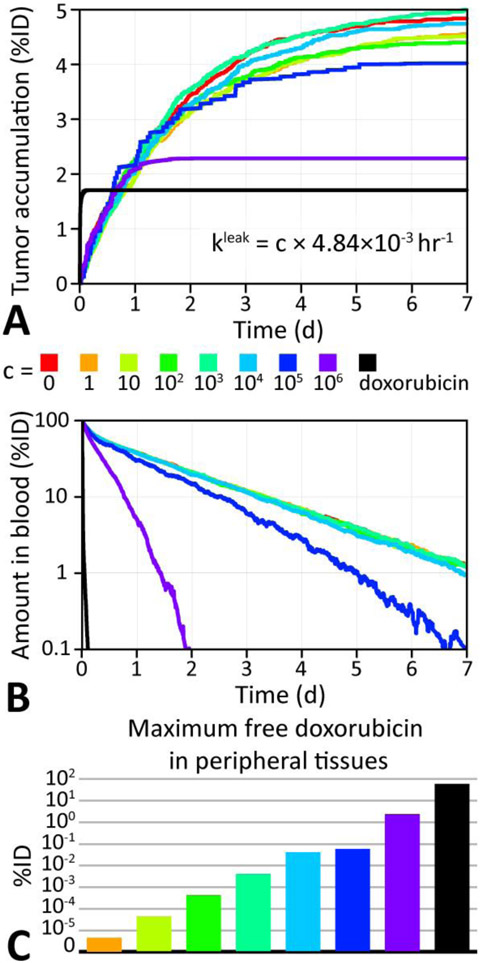
Figure 8 ∣. Comparison of doxorubicin delivery for different leakage rates from doxil.
A. Doxorubicin tumor accumulation as a percentage of the initially injected doxorubicin dose (%ID) for various leakage rate from doxil liposomes. The accumulation for free doxorubicin is also shown (black). B. Total %ID of doxorubicin in the blood as a function of time, showing the effect of leakage on clearance. C. Maximum %ID of doxorubicin in the peripheral compartment (see section 2.1) as a function of leakage rate.

