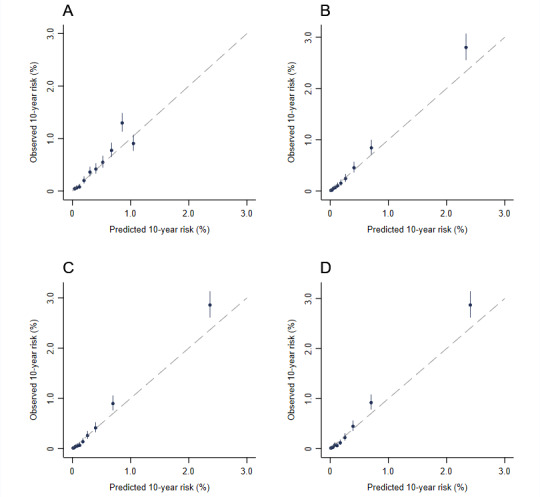
Figure 3.

Calibration plot of the esophageal cancer prediction models in the China Kadoorie Biobank by using data splitting. (A) Age-only model. (B) Simple model. (C) Intermediate model. (D) Full model. Models were fitted to a random two-thirds of the China Kadoorie Biobank data and evaluated on the remaining one-third. The calibration plots in the validation set were plotted. The observed 10-year risk was estimated by Kaplan-Meier analyses and plotted against model-predicted risk by decile.
