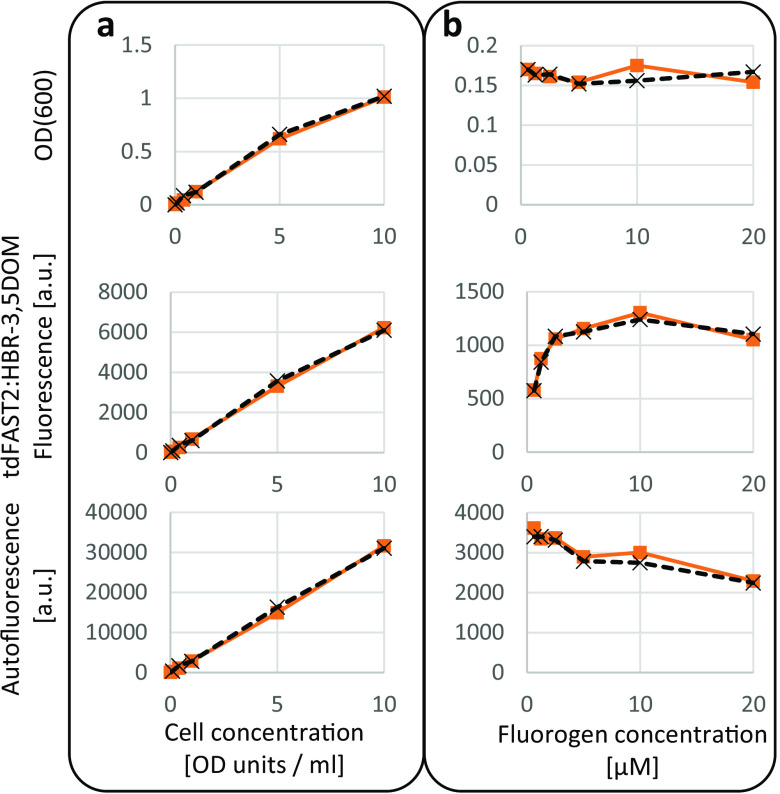
FIG 2.
Wide ranges of cell concentration and fluorogen concentration can be used to measure tdFAST2:HBR-3,5DOM fluorescence in M. acetivorans. M. acetivorans cells expressing tdFAST2 were analyzed in the exponential growth phase. A microplate reader was used to measure OD(600), tdFAST2:HBR-3,5DOM fluorescence (λEx = 515 nm/λEm = 590 nm), and autofluorescence (λEx = 420 nm/λEm = 480 nm). (a) Correlation of fluorescence and cell-density when the fluorogen concentration (5 μM) is constant. (b) Influence of the fluorogen concentration on the fluorescence when the cell concentration is constant (1 OD unit/mL). Note that, due to different light path lengths, the OD(600) determined by the microplate reader (upper panel) is smaller than the actual cell concentration (OD units/mL) which was determined using a standard spectrophotometer. Values of duplicates are shown.

