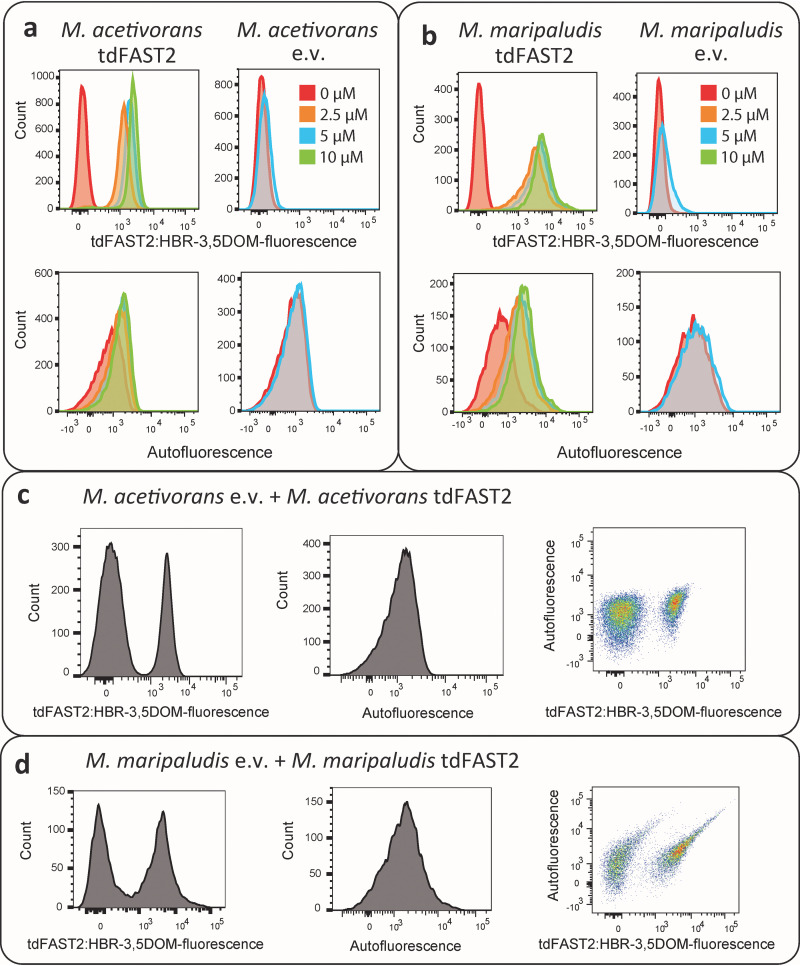
FIG 5.
Flow cytometry allows visualization of tdFAST2 expression and separation of populations. Histograms of (a) M. acetivorans and (b) M. maripaludis cells expressing tdFAST2 (tdFAST2) or control cells carrying an empty vector construct (e.v.) in the presence of increasing fluorogen (HBR-3,5DOM) concentrations. (c and d) Mixtures of tdFAST2-expressing cells and non tdFAST2-expressing cells were analyzed in the presence of 5 mM HBR-3,5DOM. M. acetivorans cultures were mixed in a 2 to 1 ratio (excess of e.v.), while M. maripaludis cultures were mixed in a 1 to 1 ratio.

