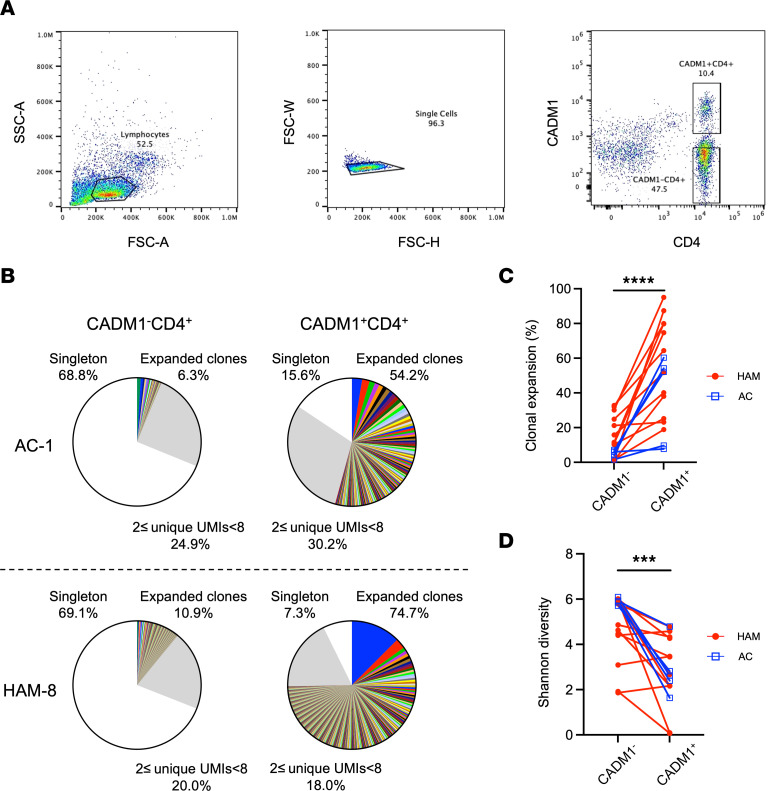
Figure 1. Clonal expansion of TCRβ repertoire in HTLV-1–infected cells of patients with HAM/TSP and ACs.
(A) Gating strategy for flow cytometry sorting of CADM1+CD4+ and CADM1–CD4+ T cells from PBMCs samples. (B) Representative examples of T cell clonal expansion in CADM1–CD4+ and CADM1+CD4+ T cells of an AC (AC-1) and a HAM/TSP patient (HAM8). Clonal expansion of TCRβ repertoire is classified by the frequencies of clones ≥ 8 UMIs (color wedges), clones with 2 ≤ UMIs < 8 (gray), and singletons (white). In the group of expanded clones, each wedge exhibits a unique clonotype with a defined CDR3 sequence, and the identical clones shared by CADM1–CD4+ and CADM1+CD4+ T cells in each individual are depicted in the same color. (C and D) Comparison of T cell clonal expansion by frequency of clones ≥ 8 UMIs (C) and Shannon diversity (D) between CADM1–CD4+ and CADM1+CD4+ T cells from ACs (n = 5) and patients with HAM/TSP (n = 12) using Wilcoxon signed-rank test. ***P < 0.001, ****P < 0.0001.

