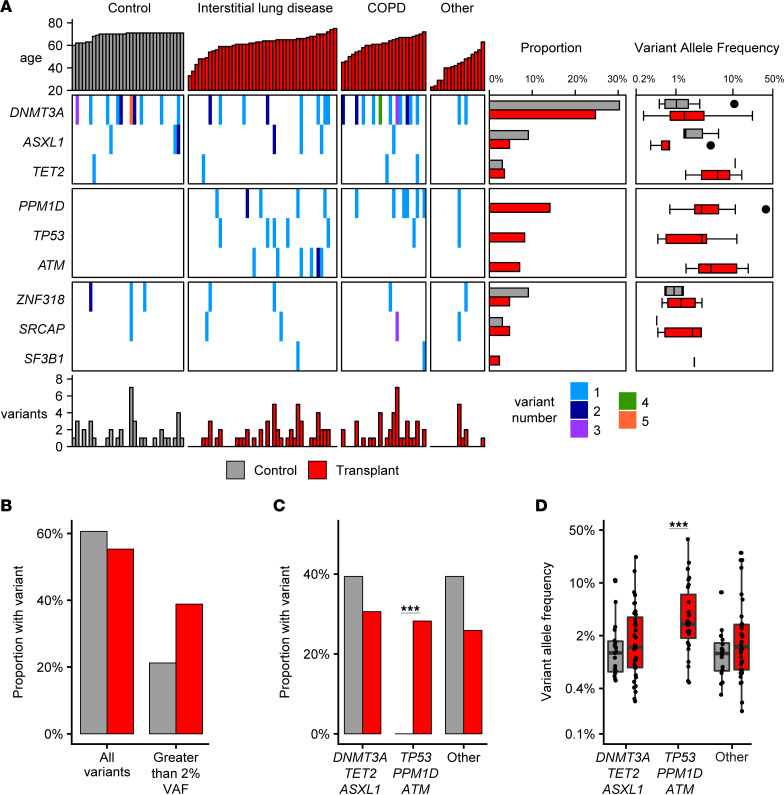
Figure 1. Clonal hematopoiesis in lung transplant recipients.
(A) Somatic variants for lung transplant recipients (red, n = 85, grouped by transplant diagnosis) and older individuals (gray, n = 33) shown for top 9 genes. Total sum of all variants per individual indicated at bottom. For each gene, the proportion of older individuals and transplant recipients and variant allele frequencies are shown at right. (B) Proportion of transplant patients and older individuals with somatic variants detected with VAF > 0.1% (left) or > 2% (right). (C) Proportion of persons with a variant in DNMT3A, TET2, or ASXL; TP53, PPM1D, or ATM; or other genes. (D) VAF of somatic variants detected in DNMT3A, TET2, or ASXL; TP53, PPM1D, or ATM; or other genes. ***P < 0.001 assessed using Fisher’s exact test with adjustment for multiple comparisons. Box plot indicates median and first and third quartiles; whiskers indicate the range of all data points falling within 1.5 × interquartile range (IQR).

