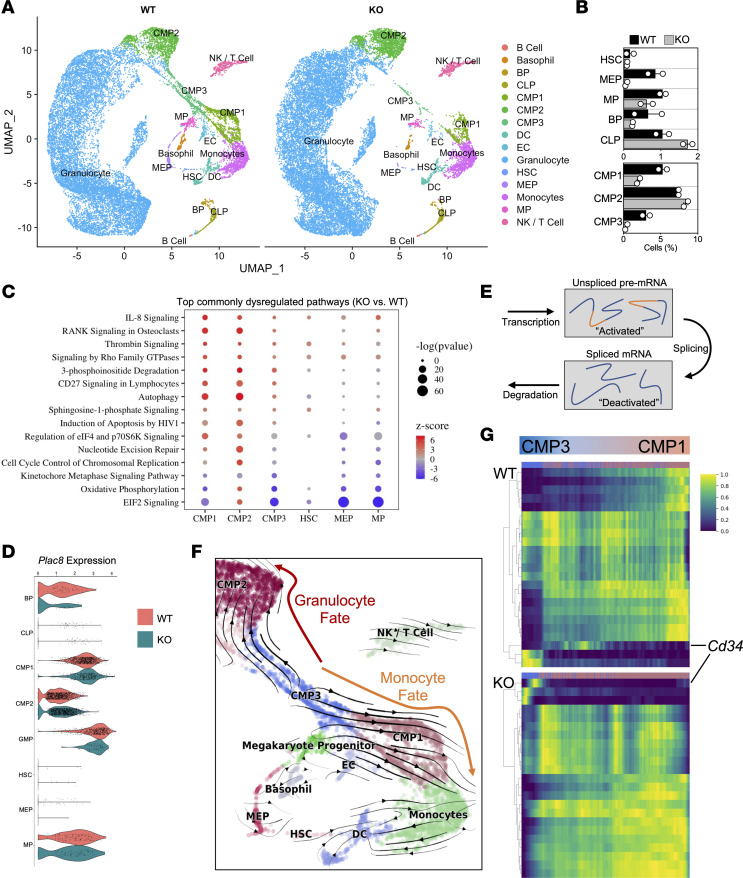
Figure 6. Single-cell resolution of stem and progenitor cells reveals impaired myelopoiesis in diabetic miR-181a2b2–deficient mice.
(A) UMAP visualization of color-coded clustering of BM niche from 2 diabetic WT (n = 19,817 cells) and 2 diabetic KO (n = 22,072 cells) mice after FAL. Each dot is 1 cell. BM niche: B cell progenitor (BP), common lymphoid progenitor (CLP), common myeloid progenitor (CMP), dendritic cell (DC), endothelial cell (EC), hematopoietic stem cell (HSC), megakaryocyte-erythrocyte progenitor (MEP), megakaryocyte progenitor (MP), and natural killer (NK) cells. (B) Relative percentage of HSPCs per mouse BM (n = 2). (C) Top commonly dysregulated pathways across different progenitors organized by –log(P value). Positive and negative z score denotes whether the majority of genes that contribute to the assigned pathway is increased or decreased, respectively, compared with WT cells. (D) Violin expression plots of Plac8 in different progenitor cells. (E) Modeling transcriptional dynamics captures transcriptional induction and repression (“activated” and “deactivated” phase) of unspliced pre-mRNAs, their conversion into mature, spliced mRNAs, and their eventual degradation. (F) Velocities derived from the dynamical model for hematopoiesis are visualized as streamlines in a UMAP-based embedding. (G) Top 20 gene expression dynamics along latent time from CMP3 toward CMP1 cells.

