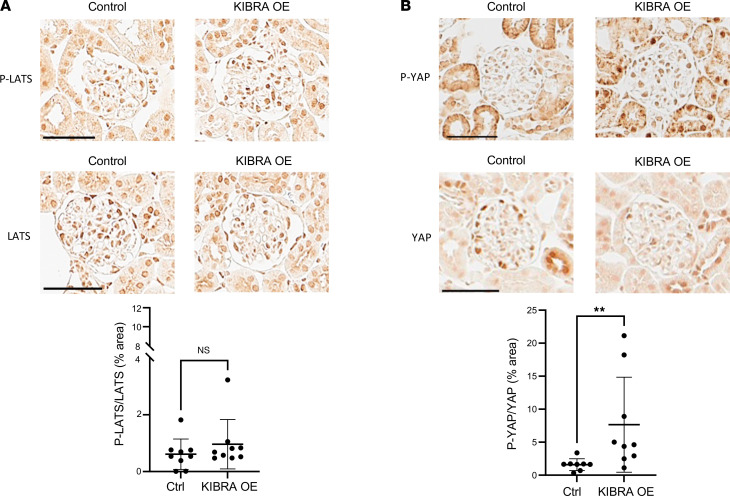
Figure 5. LATS and YAP phosphorylation in ADR-treated KIBRA-OE mice.
Adriamcyin-treated KIBRA-OE mice show (A) a nonsignificant increase in p-LATS/LATS expression compared with control mice (n = 9 control, 9 KIBRA-OE mice) and (B) significantly increased p-YAP/YAP expression compared with control mice (n = 8 control, 9 KIBRA-OE mice). Original magnification, ×40. Scale bars: 50 μm. **P < 0.01 by 2-tailed Mann-Whitney test. NS, not significant.

