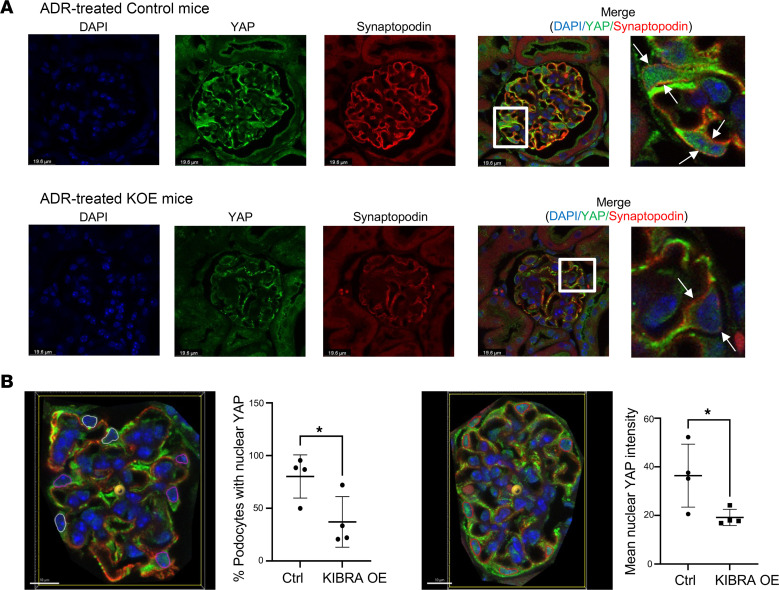
Figure 6. YAP localization in ADR-treated mice.
(A) ADR-treated KIBRA-OE mice show decreased nuclear YAP and increased cytoplasmic YAP localization in podocytes (podocytes in zoomed areas labeled by white arrows) compared with ADR-treated control mice. Original magnification, ×63. Scale bars: 19.6 μm and 5.5 μm (zoomed areas labeled by white boxes). (B) Representative images illustrating 2 methods utilized to quantify nuclear YAP localization: quantification of percentage of podocytes with positive nuclear YAP staining based on a set threshold intensity within DAPI-labeled podocyte nuclei (left image: pink = podocyte nuclei positive for YAP staining, white = podocyte nuclei negative for YAP staining), and quantification of mean nuclear YAP intensity within DAPI-labeled podocyte nuclei (right image: red = all podocyte nuclei). Scale bars: 10 μm. n = 4 control, 4 KIBRA-OE mice.*P < 0.05 by 2-tailed t test.

