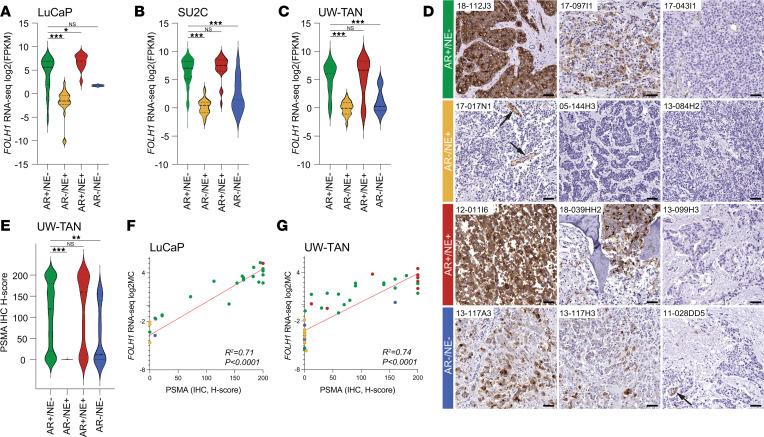
Figure 1. PSMA expression patterns differ between molecular subtypes of lethal metastatic prostate cancer.
(A–C) Violin plots show distribution of FOLH1 expression (log2 FPKM) across molecular subtypes (AR+/NE– [green], AR–/NE+ [yellow], AR+/NE+ [red], and AR–/NE– [blue]), determined by RNA-Seq in LuCaP PDX (n = 126) (A), SU2C (n = 270) (B), and UW-TAN (n = 172) tumors (C) (see Supplemental Table 1 for a breakdown of samples across all molecular phenotypes). (D) Representative micrographs of PSMA IHC in different molecular subtypes. Arrows indicate PSMA-positive endothelial cells in cases with absence of tumor cell–specific PSMA expression. (E) Violin plot depicts PSMA-expression H-scores from the UW-TAN cohort (n = 636). (F and G) Correlation plots show a significant positive association (R2 based on Pearson correlation) between PSMA protein expression (by IHC) and FOLH1 mRNA expression (by RNA-seq) in LuCaP (n = 25) (F) and UW-TAN samples (n = 50) (G). Dot colors indicate molecular phenotypes, as above. Scale bars: 50 μm. *P < 0.05; **P < 0.001; ***P < 0.0001, based on Wilcoxon rank tests.

