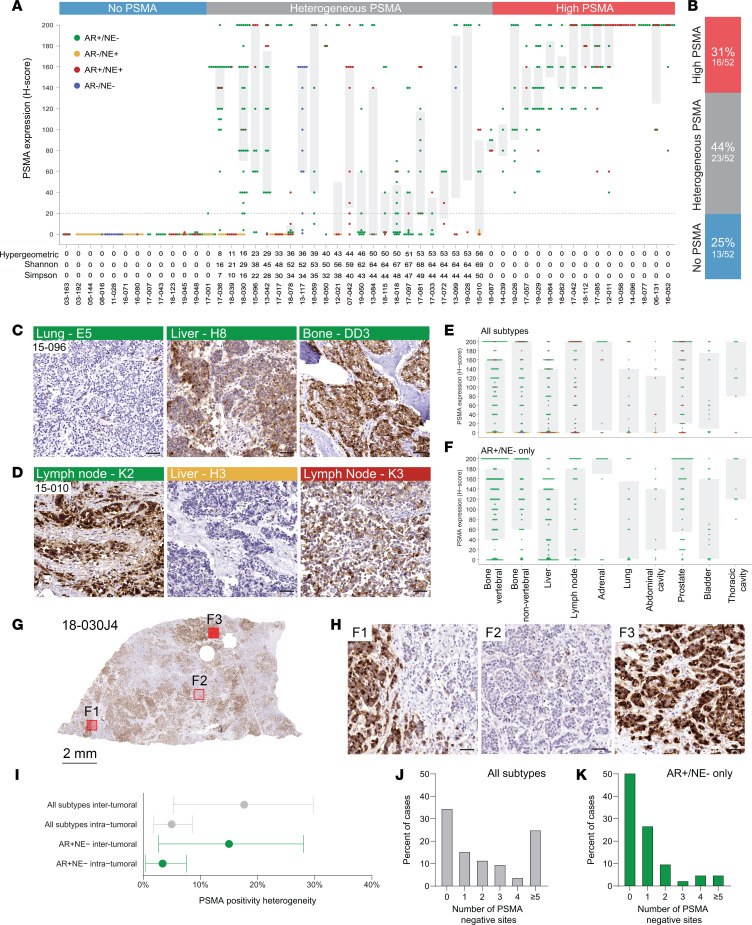
Figure 2. Inter- and intrapatient PSMA expression heterogeneity.
(A) Dot and box plot show the distribution of PSMA protein expression H-scores in 52 cases from the UW-TAN rapid autopsy cohort (total sample n = 636). Each dot represents a tumor sample; the color codes indicate the molecular subtype (AR+/NE– [green], AR–/NE+ [yellow], AR+/NE+ [red] and AR–/NE– [blue]). Gray shadings show interquartile ranges. (B) Summary of frequencies of cases with uniformly low/negative PSMA expression (all sites H-score ≤ 20), heterogeneous PSMA expression (both H-scores ≤ 20 and H-score > 20) and uniformly high PSMA expression (all sites with H-scores > 20). (C) Representative micrographs of PSMA expression patterns in 3 anatomically distinct metastatic sites (all AR+/NE–) from 1 case (case 15-096). (D) PSMA expression in a case with divergent subtypes (case 15-010). (E and F) Distribution of PSMA expression H-scores across different organ sites in all tumors (E) and AR+/NE– tumors (F). (G) PSMA expression heterogeneity within a metastatic lesion (intratumoral heterogeneity). Left panel shows low power (1×) view of a full-face tumor section. Areas with divergent PSMA expression are indicated (F1–F3). (H) High-power view (20×) of 3 tumor foci (F1–F3 from G) showing high level intratumoral expression heterogeneity. (I) Mean (95% CI) hypergeometric PSMA expression heterogeneity indices across different metastatic sites in a given patient (intertumoral heterogeneity) and within a metastatic site (intratumoral heterogeneity) for the entire cohort (gray) and AR+/NE– tumors (green). (J and K) Percentage of cases with no (0), 1, 2, 3, 4 or ≥ 5 metastatic sites with a PSMA H-score ≤ 20 (PSMA-negative metastatic sites). Numbers are shown separately for the entire cohort (gray bars) (J) and in AR+/NE– tumors only (green bars) (K). Scale bars: 50 μm.

