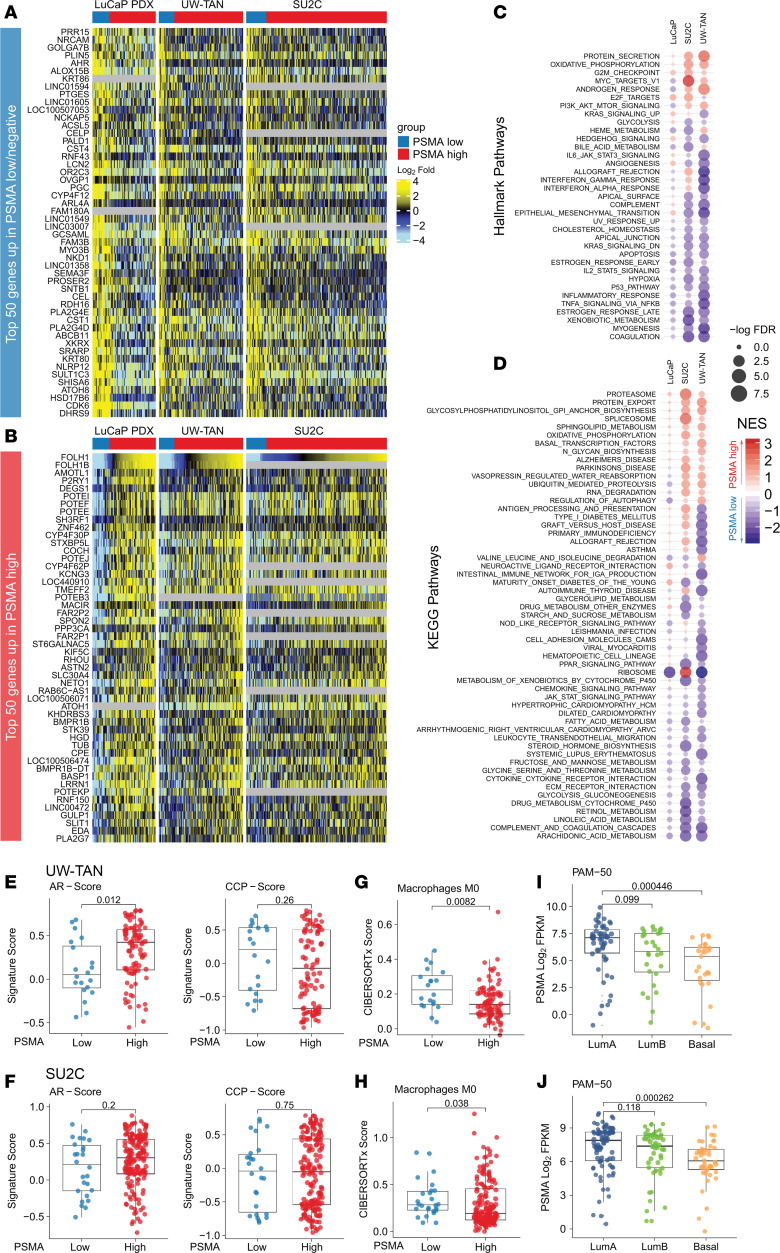
Figure 3. Tumors with low/negative PSMA expression show distinct expression changes.
(A and B) Heatmap showing the top 50 genes upregulated in AR+/NE– tumors from the LuCaP PDX (n = 82), UW-TAN (n = 109), and SU2C (n = 182) cohorts with low/negative PSMA expression (A) and high PSMA expression (B). (C and D) Gene set enrichment analyses using Hallmark Pathways (C) and KEGG Pathways (D) show gene sets enriched in PSMA high (red) and PSMA-low/negative (blue) tumors. NES denotes normalized enrichment score. (E and F) Comparisons of AR signaling activity (AR-score) and cell proliferation (CCP-score) using gene set variation analyses (Supplemental Figures 12 and 13) between PSMA-low/negative and PSMA-high AR+/NE– tumors in the UW-TAN (E) and SU2C (F) cohorts. (G and H) CIBERSORTx analyses demonstrate differences in macrophage infiltration between PSMA high and PSMA low/negative tumors in UW-TAN (G) and SU2C (H) cohorts. (I and J) Differences in PSMA expression based on luminal A, luminal B, and basal PAM-50 status in UW-TAN (I) and SU2C (J) cohorts. P values are based Wilcoxon rank tests.

