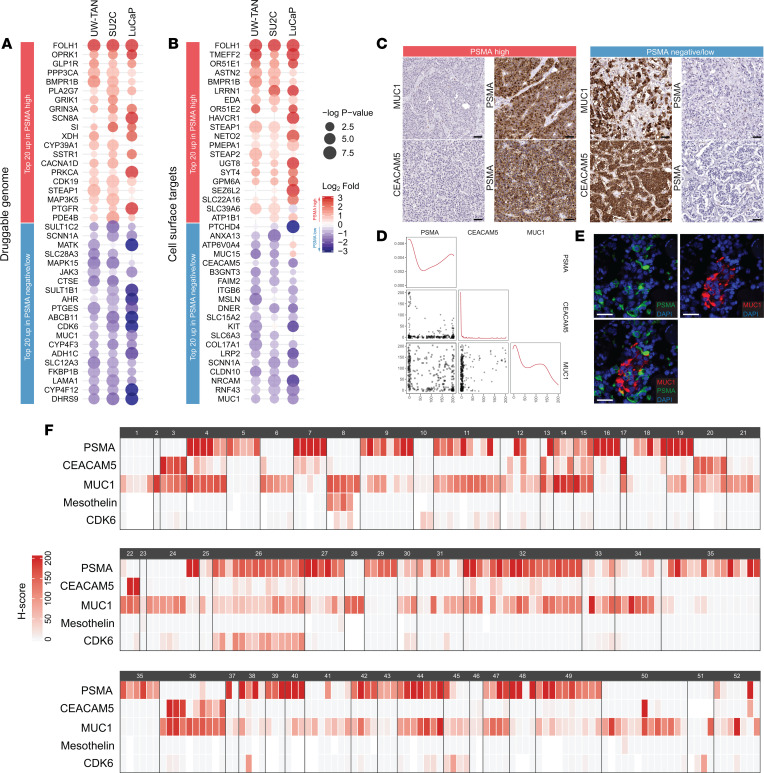
Figure 4. PSMA-low/negative tumors show targetable alterations.
(A) Heatmap of top 20 differentially expressed genes with annotated drug target properties from the druggable genome database (rank ordered based on fold expression difference) between PSMA-high (red) and PSMA-low/negative (blue) AR+/NE– tumors in UW-TAN, SU2C, and LuCaP PDX cohorts. (B) Top 20 differentially expressed genes encoding for cell surface proteins between PSMA-high (red) and PSMA-low/negative (blue) tumors in UW-TAN, SU2C, and LuCaP PDX. Heatmaps are sorted by rank order based on mean fold change differences, and directionality is color coded: red, higher in PSMA-high; blue, higher in PSMA-low/negative. (C) Representative micrographs of CEACAM5 and MUC1 IHC in PSMA-negative/low and PSMA-high tumors. (D) Correlation plots for PSMA, MUC1, and CEACAM5 protein expression. (E) Dual fluorescence images showing distinct cell population labeling for MUC1 (red) and PSMA (green). (F) Heatmaps of PSMA, CEACAM5, MUC1, mesothelin, and CDK6 expression based on IHC H-scores across 289 metastatic sites in 52 patients. Expression scores for each protein target are color coded from light gray to red. White boxes indicate missing data. Each colored box represents a metastatic site; black boxes outline each case (see Supplemental Table 8 for UW-TAN case identifiers). Scale bars: 50 μm.

