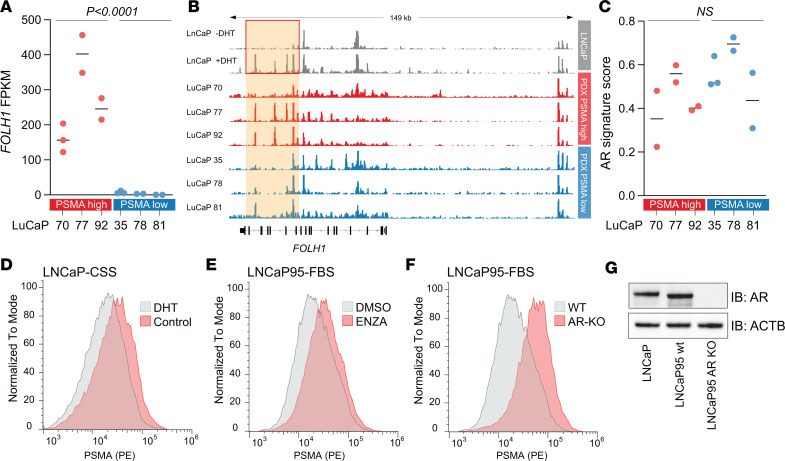
Figure 5. AR-mediated changes in PSMA expression.
(A) FOLH1 mRNA expression in AR+ LuCaP PDX lines. (B) AR ChIP-Seq tracks in LNCaP cell line and LuCaP PDX tissues show AR recruitment at the FOLH1 locus. Red box highlights dihydrotestosterone-induced (DHT-induced) peaks in LNCaP cells. (C) Distribution of 10-gene AR signature (23) across LuCaP models. P values are based on 2-tailed t tests. (D and E) Density plots show PSMA cell surface expression in LnCaP and LNCaP95 (as indicated) in the absence or presence of 10 nM DHT (D) or 10μM enzalutamide (ENZA) (E) for 6 days. (F) PSMA cell surface expression in LNCaP95 AR-KO and parental WT cells. (G) Western blot shows complete loss of AR protein expression in AR-KO cells (40).

