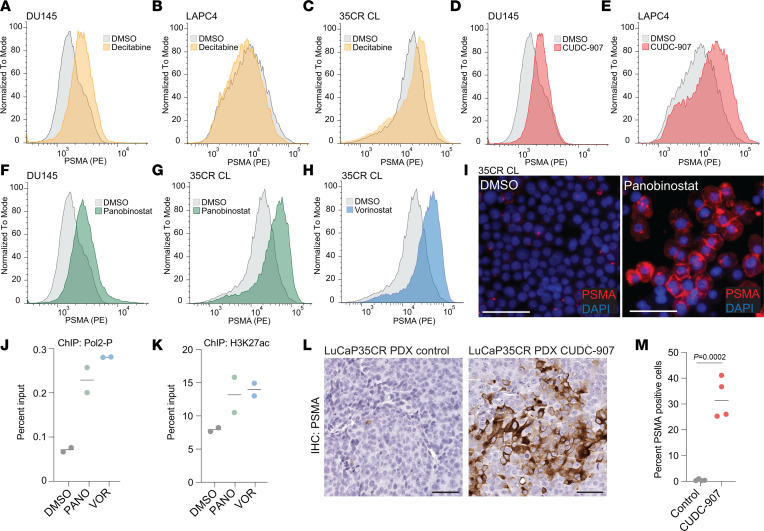
Figure 7. Pharmacologic epigenetic modifiers reverse PSMA silencing.
(A–C) Density plots show PSMA cell surface expression in DU145 (A), LAPC4 (B), and LuCaP 35CR cell line (CL) (C) cells treated for 6 days with vehicle control (DMSO) or 500 nM decitabine (DAC). (D–H) PSMA expression in DU145, LAPC4, and LuCaP 35CR CL cells treated for 6 days with panobinostat (PANO, 10 nM), CUDC-907 (50 nM), or vorinostat (VOR, 1 μM). (I) Representative micrographs of cytospin preparations of LuCaP 35CR CL treated with DMSO or panobinostat (10 nM) stained for PSMA (red) and DAPI (blue). (J and K) Chromatin immunoprecipitation studies show serine 5 phosphorylated RNA polymerase 2 (Pol2-P) (J) and H3K27ac (K) enrichment normalized to input in LuCaP 35CR CL treated with vorinostat (VOR, 1 μM), panobinostat (PANO, 10 nM), or DMSO. (L) Micrographs of LuCaP 35CR PDX tumors stained for PSMA grown in mice treated with solvent control (30% captisol) or CUDC-907 at a dose of 75 mg/kg/day for 21 days. (M) Percent of PSMA-positive cells in control and CUDC-907 treated tumors (n = 4 per group). P value are based on 2-tailed t tests. Scale bars: 50 μm.

